Charts
Data charts published by VCs, investors and analysts in their articles and newsletters. Each links to its source.
343 charts
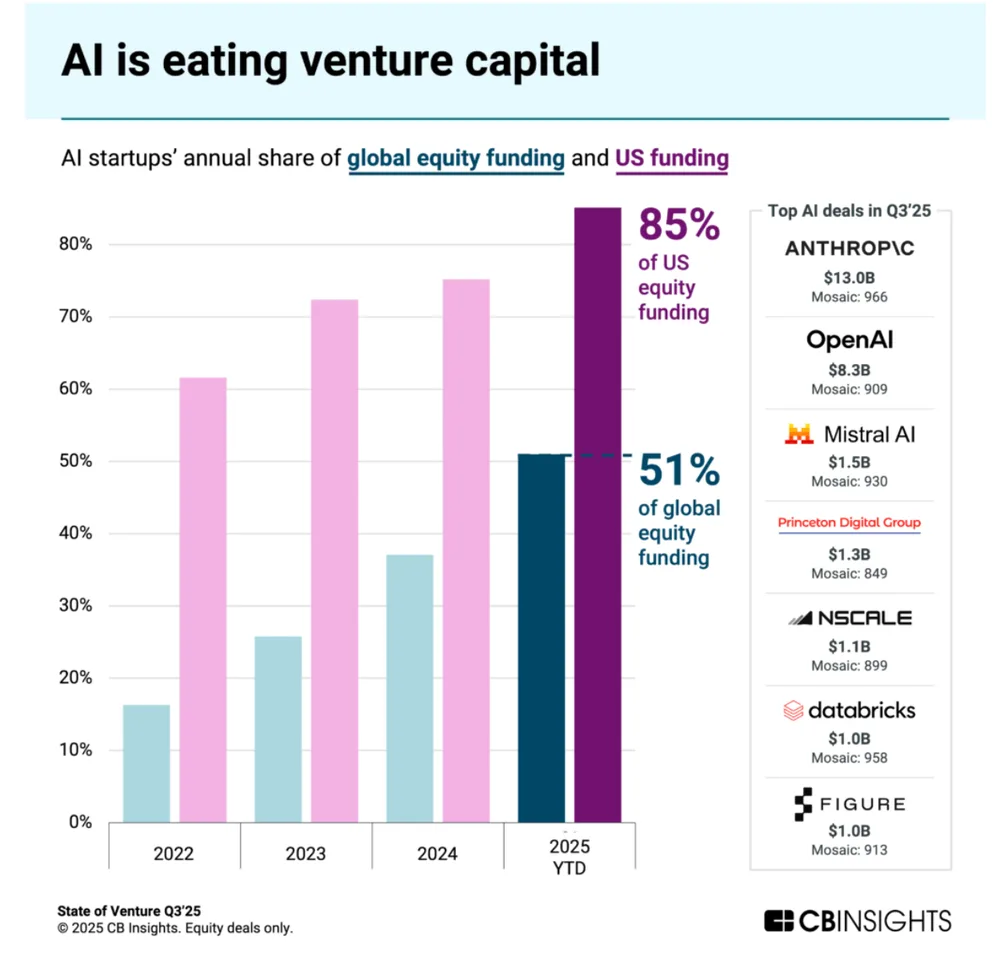 AI is eating venture capital0100 Conferences (newsletter) · December 2025
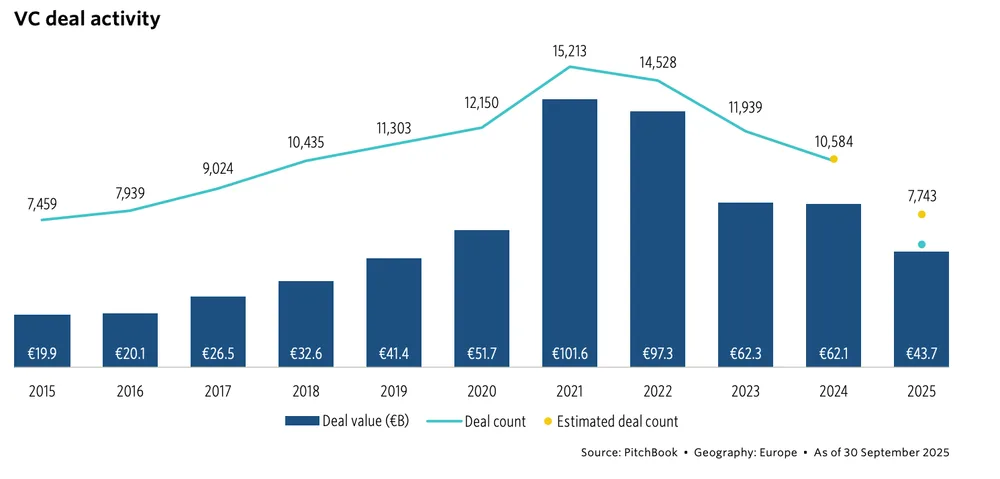 VC deal activity0100 Conferences (newsletter) · December 2025
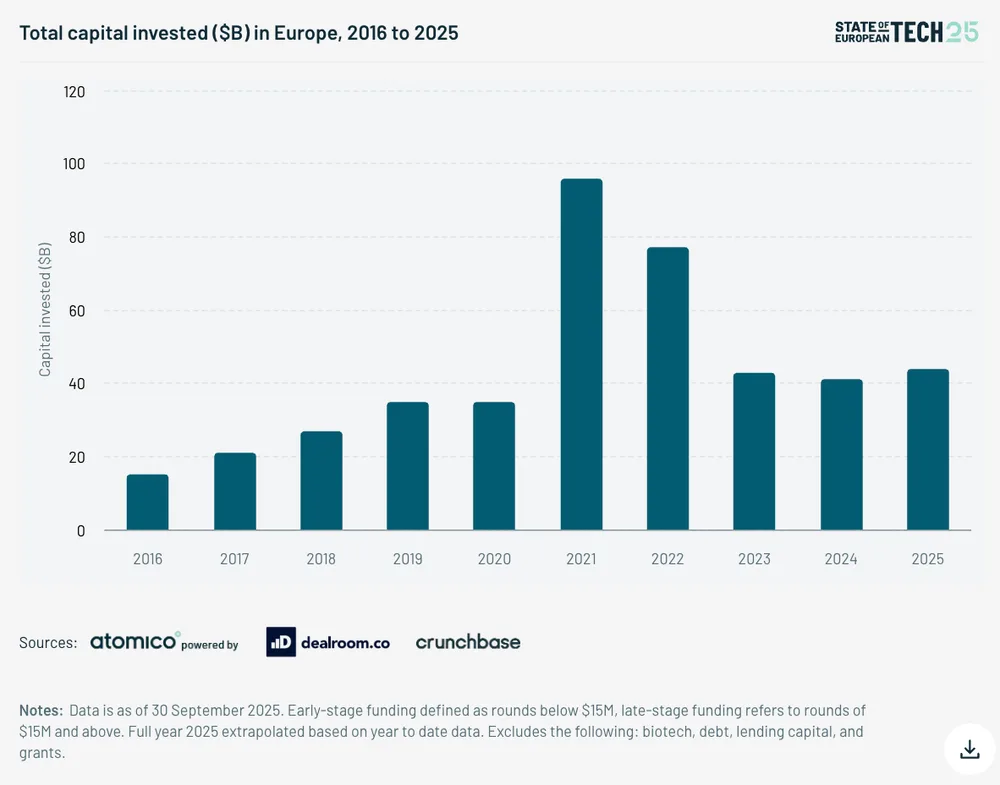 Total capital invested ($B) in Europe, 2016 to 20250100 Conferences (newsletter) · December 2025
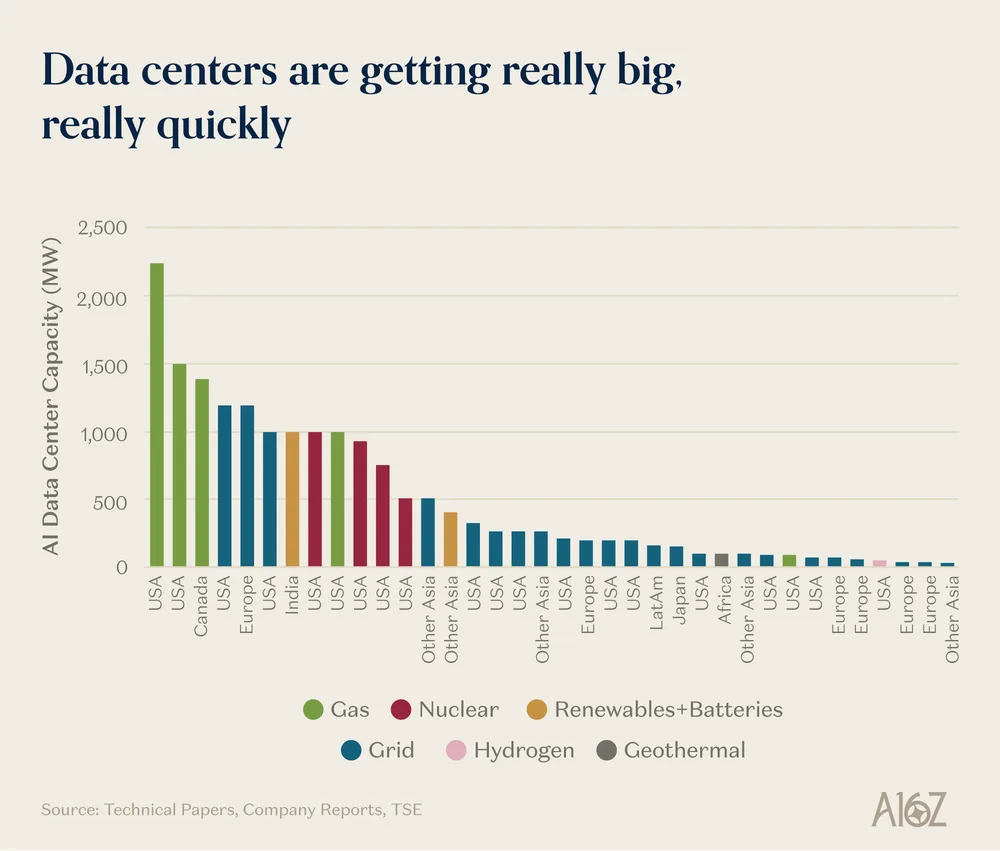 Data centers are getting really big, really quicklya16z News · November 2025
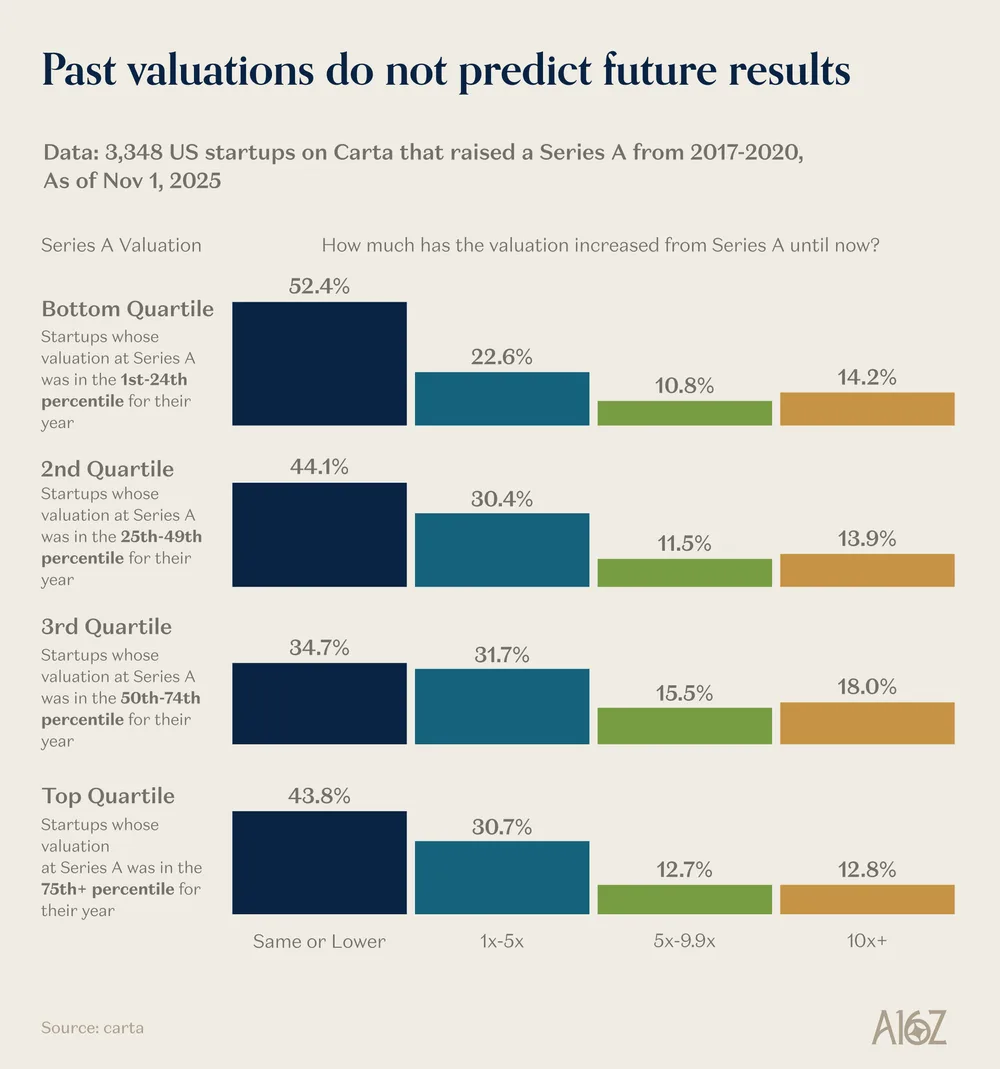 Past valuations do not predict future resultsa16z News · November 2025
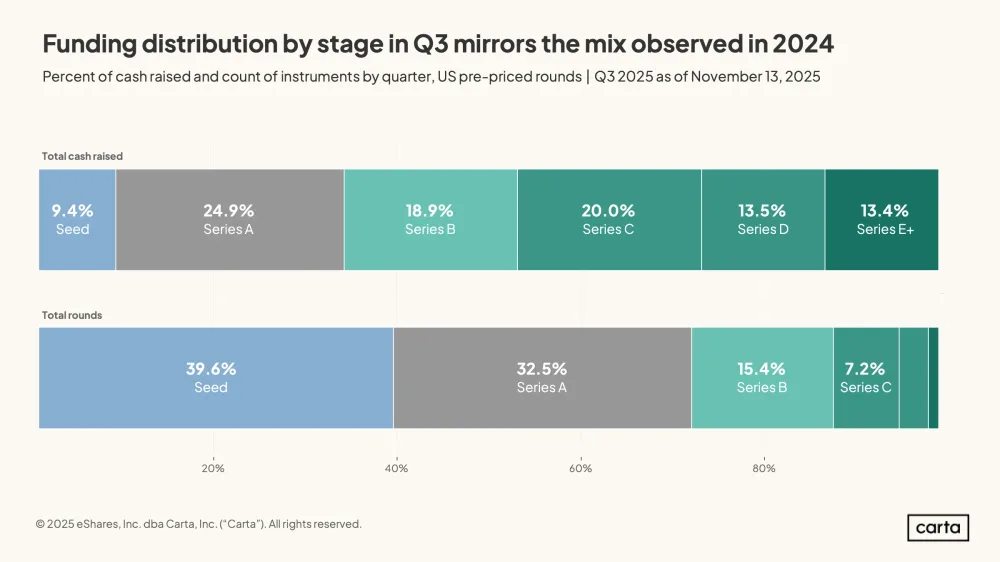 Funding distribution by stage in Q3 mirrors the mix observed in 2024Carta Data · November 2025
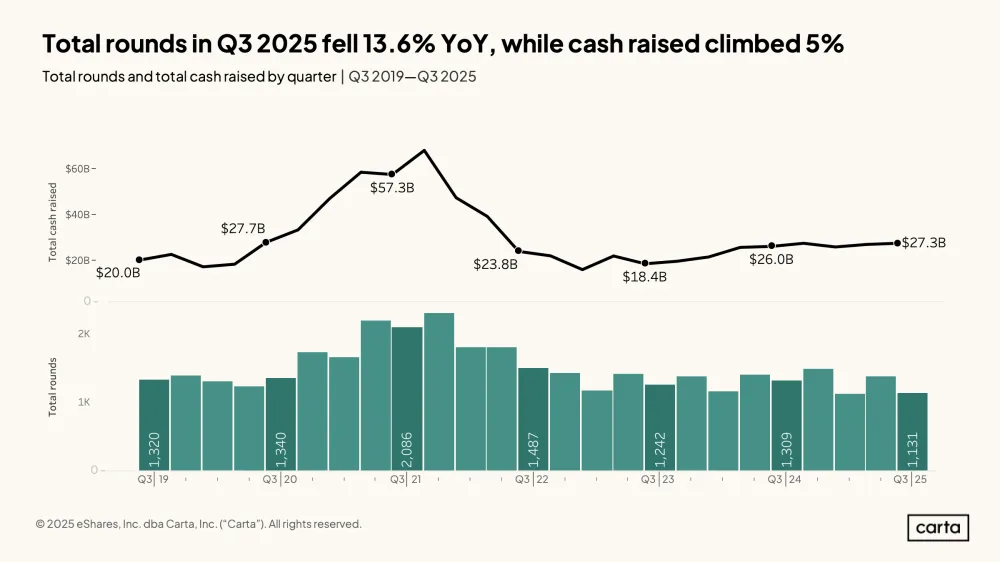 Total rounds in Q3 2025 fell 13.6% YoY, while cash raised climbed 5%Carta Data · November 2025
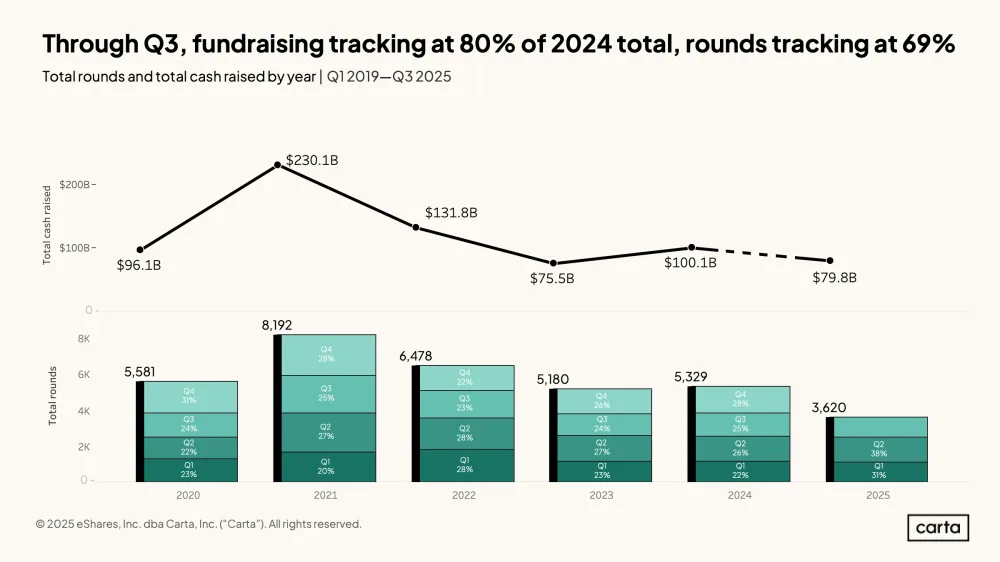 Through Q3, fundraising tracking at 80% of 2024 total, rounds tracking at 69%Carta Data · November 2025
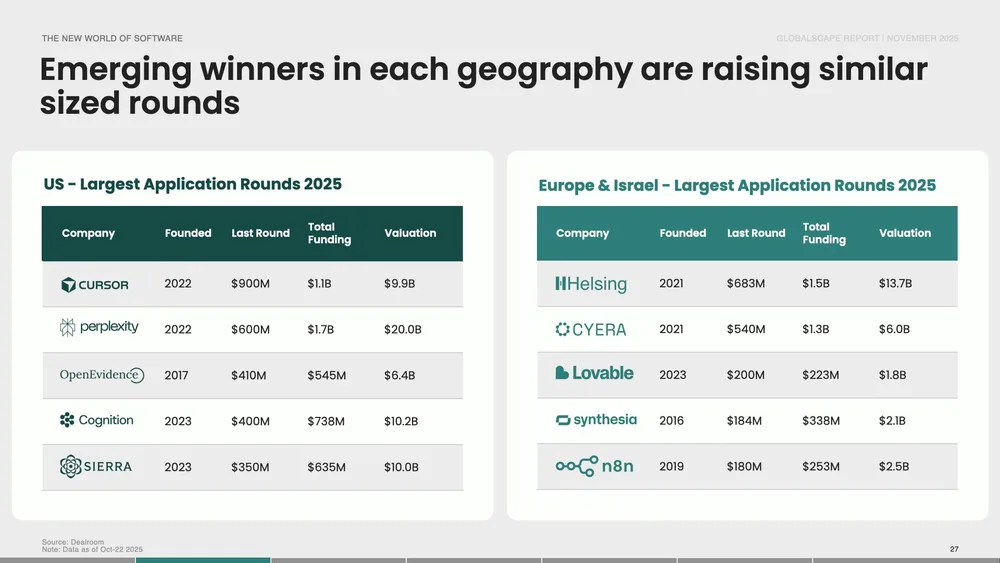 Emerging winners in each geography are raising similar sized roundsAccel · November 2025
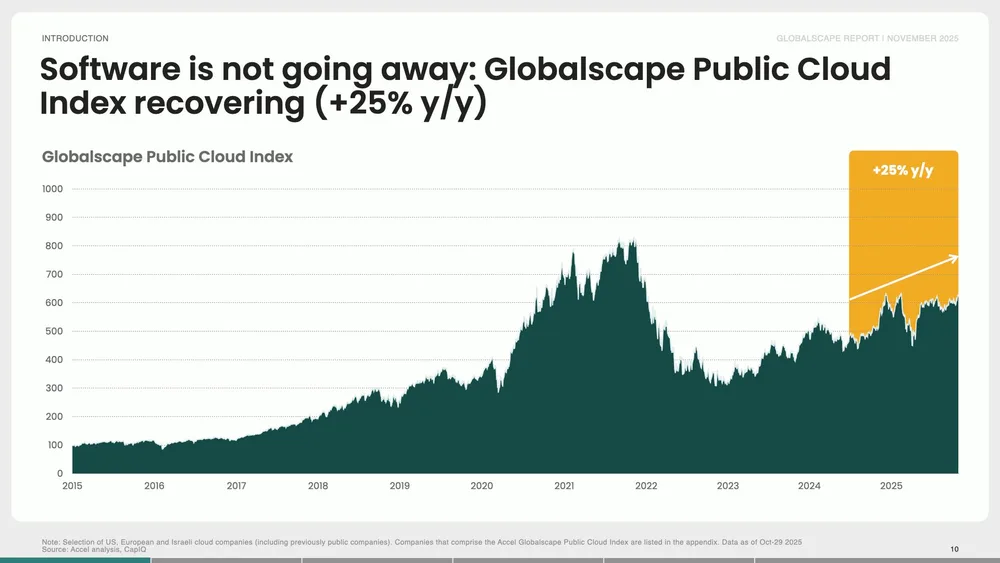 Globalscape Public Cloud IndexAccel · November 2025
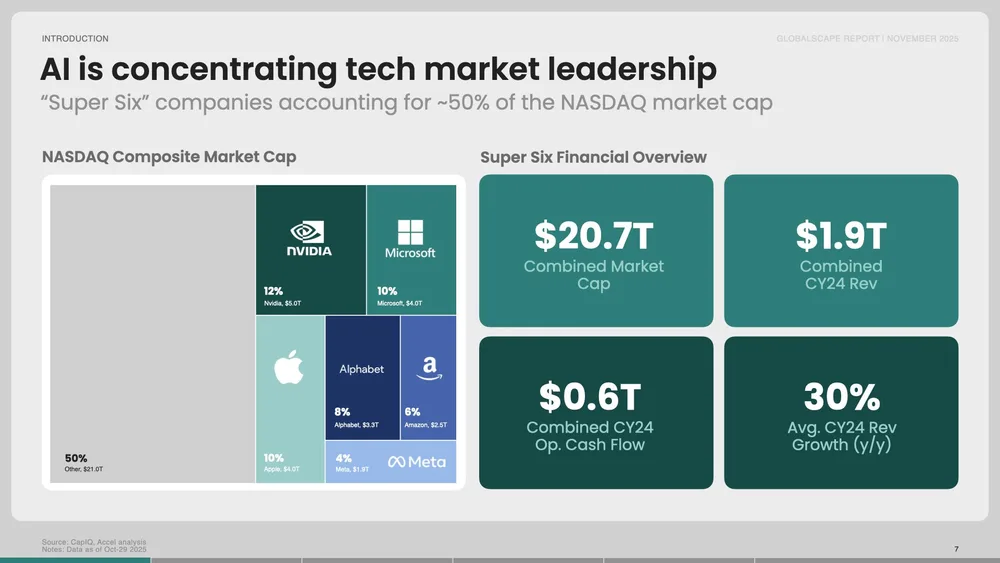 AI is concentrating tech market leadershipAccel · November 2025
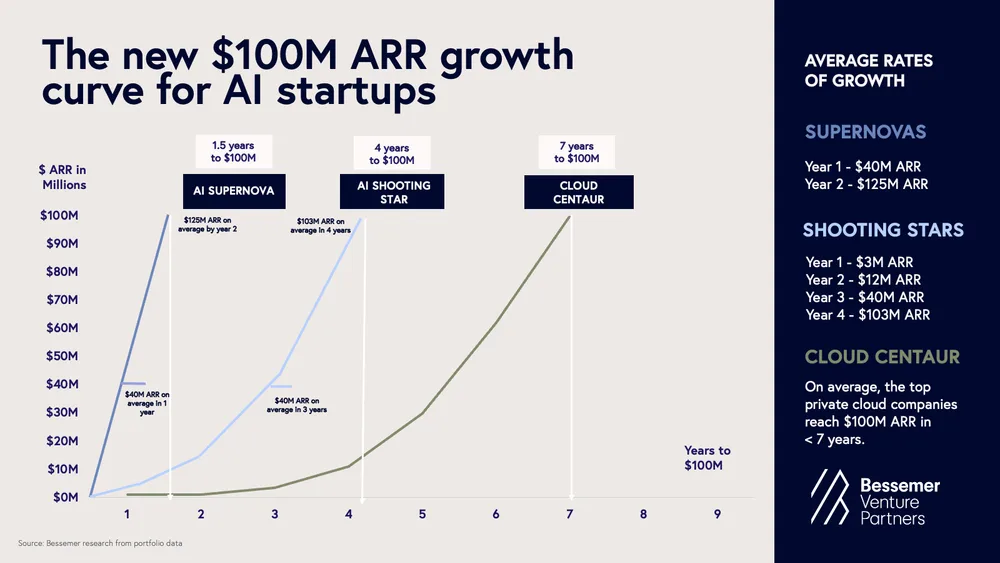 The new $100M ARR growth curve for AI startupsBessemer Venture Partners · August 2025
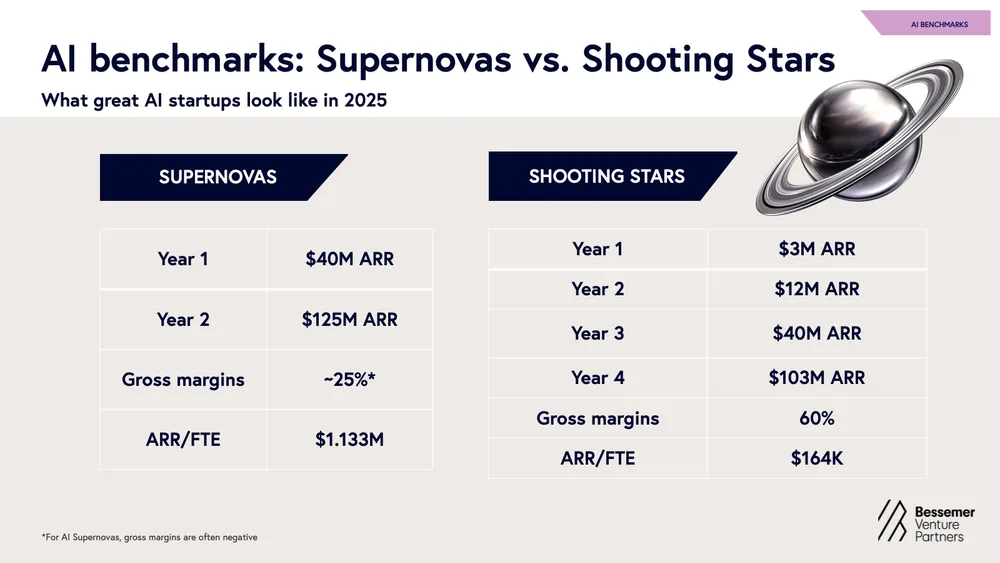 AI benchmarks: Supernovas vs. Shooting StarsBessemer Venture Partners · August 2025
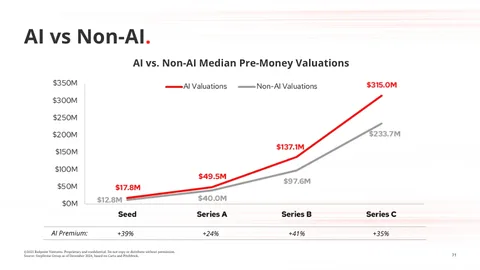 AI vs. Non-AI Median Pre-Money ValuationsRedpoint Ventures · June 2025
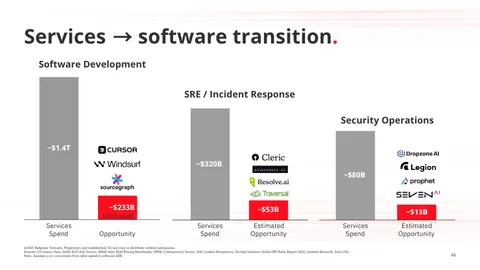 Services → software transition.Redpoint Ventures · June 2025
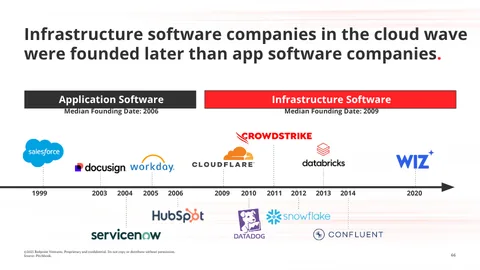 Infrastructure software companies in the cloud wave were founded later than app software companiesRedpoint Ventures · June 2025
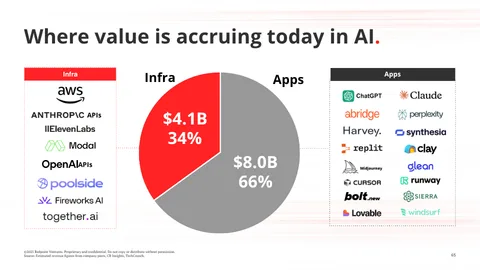 Where value is accruing today in AI.Redpoint Ventures · June 2025
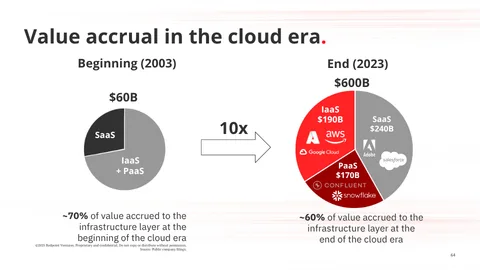 Value accrual in the cloud eraRedpoint Ventures · June 2025
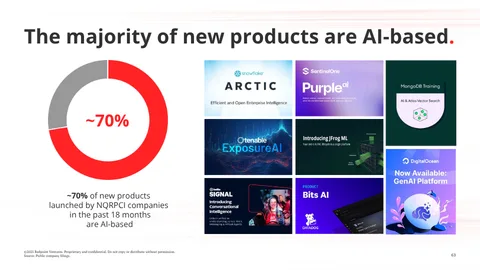 The majority of new products are AI-basedRedpoint Ventures · June 2025
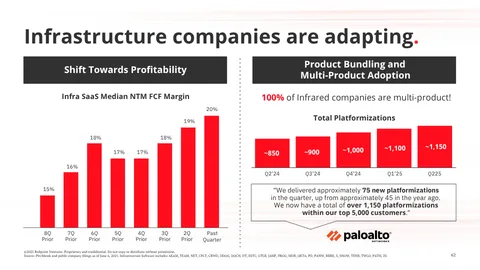 Infra SaaS Median NTM FCF MarginRedpoint Ventures · June 2025
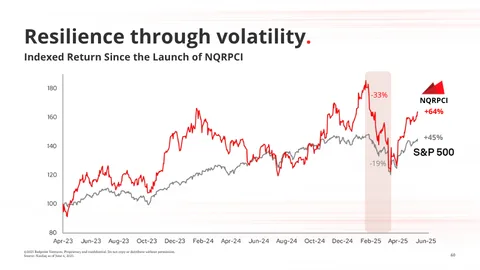 Resilience through volatility.Redpoint Ventures · June 2025
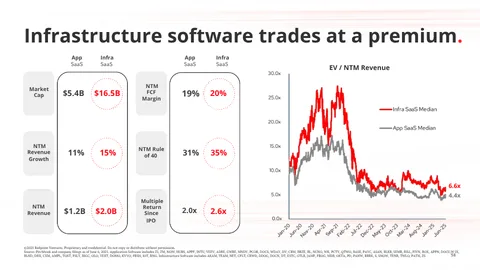 Infrastructure software trades at a premium.Redpoint Ventures · June 2025
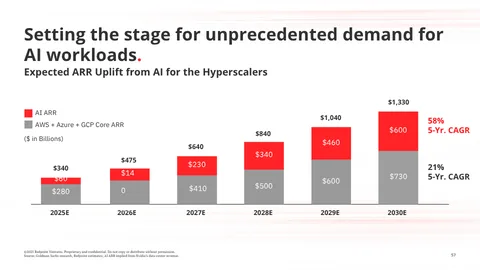 Expected ARR Uplift from AI for the HyperscalersRedpoint Ventures · June 2025
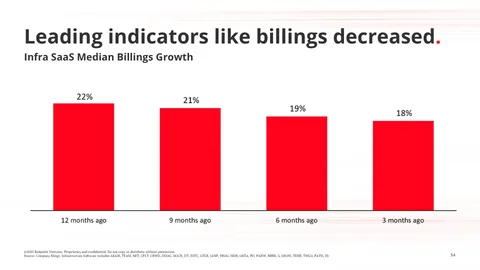 Infra SaaS Median Billings GrowthRedpoint Ventures · June 2025