Services → software transition.
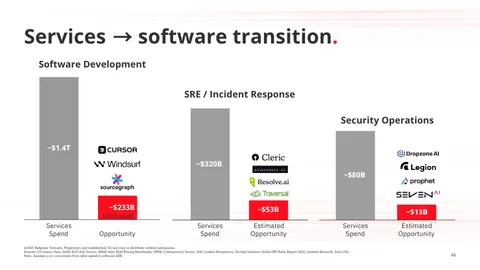
Comparison of services spend versus estimated software market opportunity across software development, SRE/incident response, and security operations sectors.
| Label | Value shown on the chart |
|---|---|
| Software Development - Services Spend | ~$1.4T |
| Software Development - Estimated Opportunity | ~$233B |
| SRE / Incident Response - Services Spend | ~$320B |
| SRE / Incident Response - Estimated Opportunity | ~$53B |
| Security Operations - Services Spend | ~$80B |
| Security Operations - Estimated Opportunity | ~$13B |
Shown as a preview with credit and a link to the original. Publishers can request removal.
View the original on redpoint.com