Resilience through volatility.
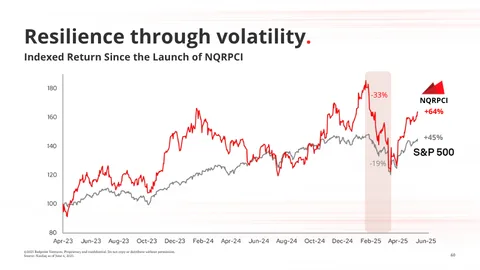
This line chart shows the indexed return of the NQRPCI index compared to the S&P 500 from April 2023 to June 2025. NQRPCI gained 64% over the period, outperforming the S&P 500's 45% return despite experiencing a sharper drawdown of 33%.
| Label | Value shown on the chart |
|---|---|
| NQRPCI Return | +64% |
| S&P 500 Return | +45% |
| NQRPCI Drawdown | -33% |
| S&P 500 Drawdown | -19% |
Shown as a preview with credit and a link to the original. Publishers can request removal.
View the original on redpoint.com