Charts
Data charts published by VCs, investors and analysts in their articles and newsletters. Each links to its source.
343 charts
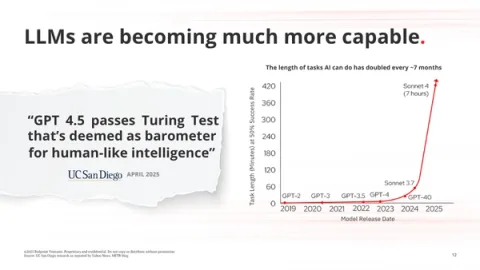 The length of tasks AI can do has doubled every ~7 monthsRedpoint Ventures · June 2025
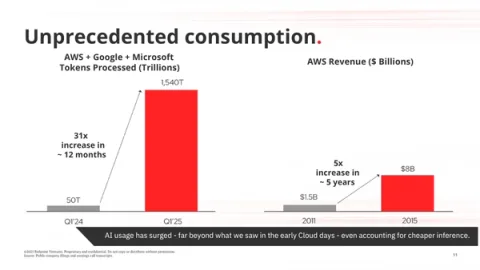 Unprecedented consumptionRedpoint Ventures · June 2025
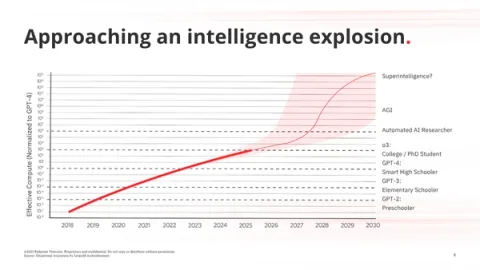 Approaching an intelligence explosion.Redpoint Ventures · June 2025
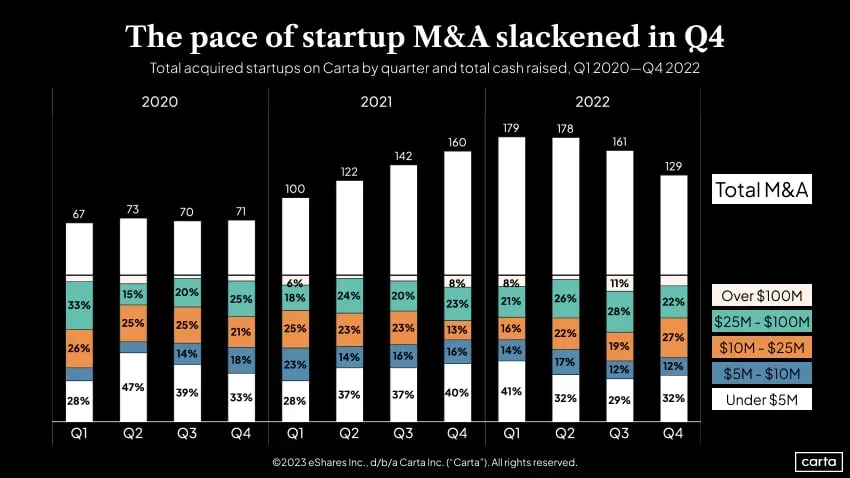 The pace of startup M&A slackened in Q4Carta Data · February 2023
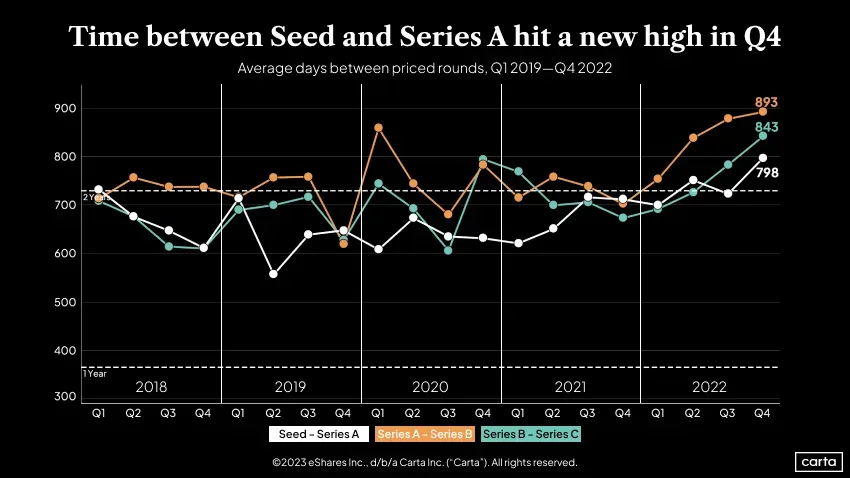 Time between Seed and Series A hit a new high in Q4Carta Data · February 2023
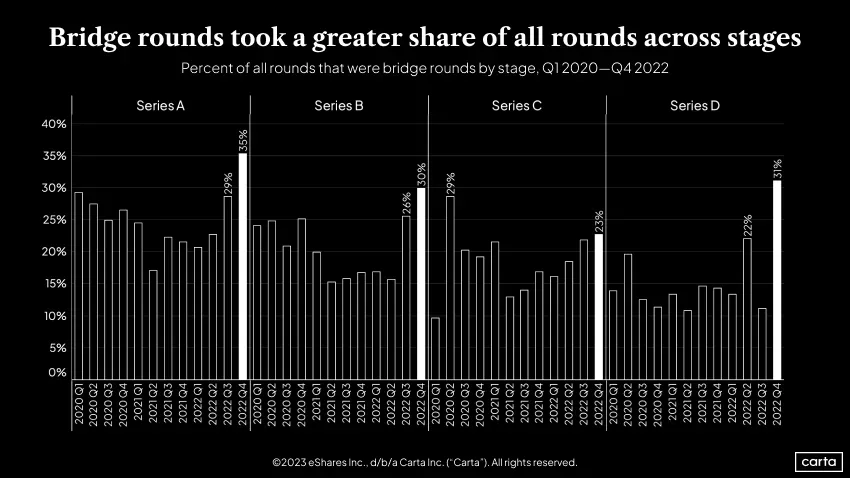 Bridge rounds took a greater share of all rounds across stagesCarta Data · February 2023
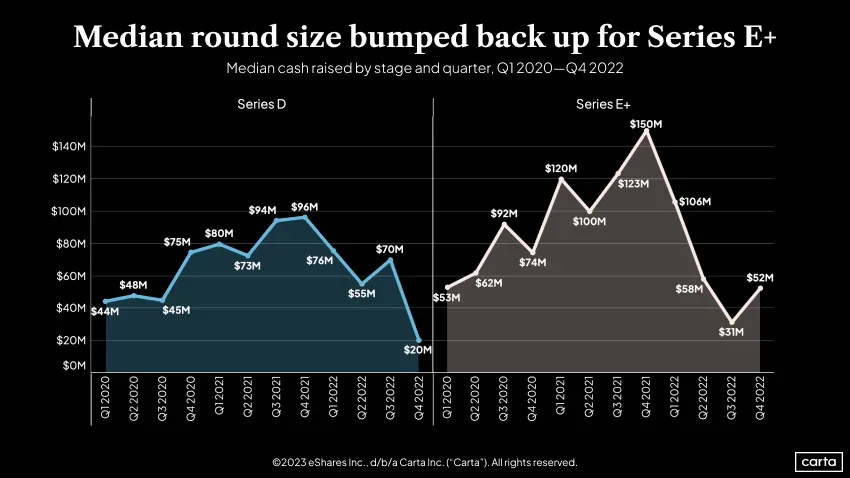 Median round size bumped back up for Series E+Carta Data · February 2023
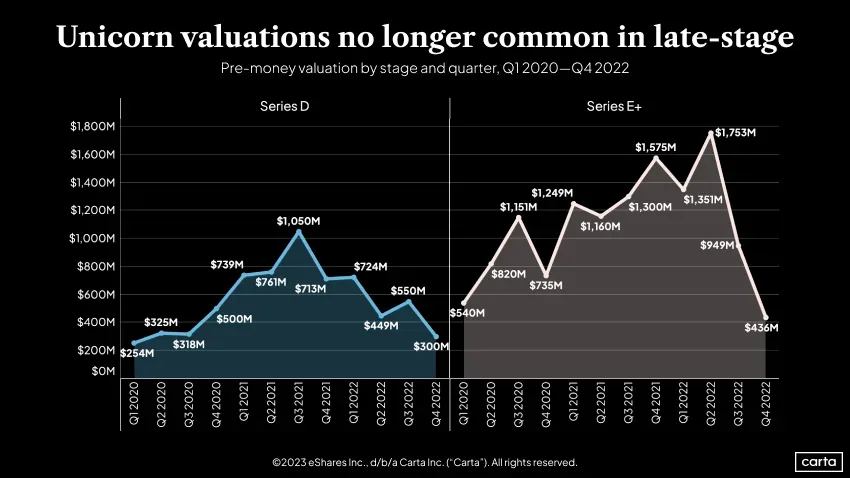 Unicorn valuations no longer common in late-stageCarta Data · February 2023
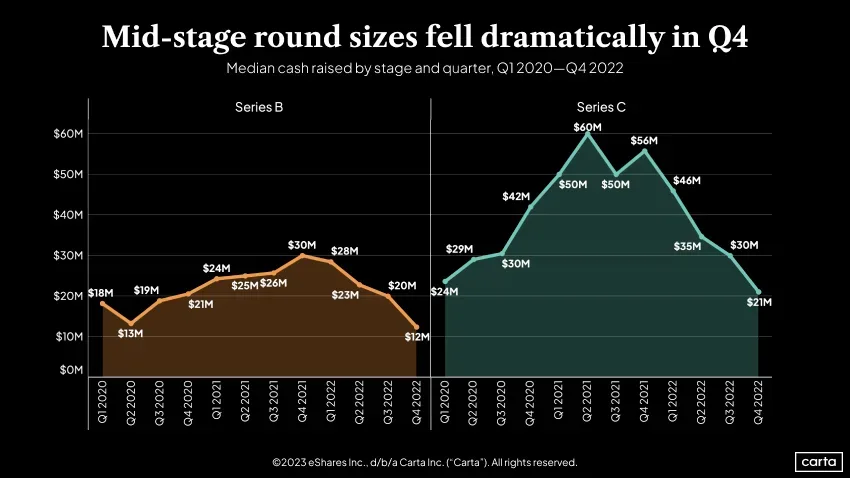 Mid-stage round sizes fell dramatically in Q4Carta Data · February 2023
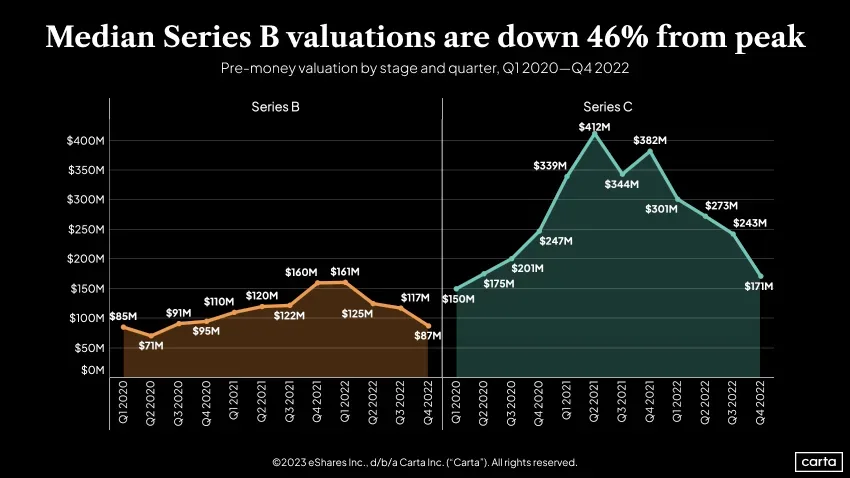 Median Series B valuations are down 46% from peakCarta Data · February 2023
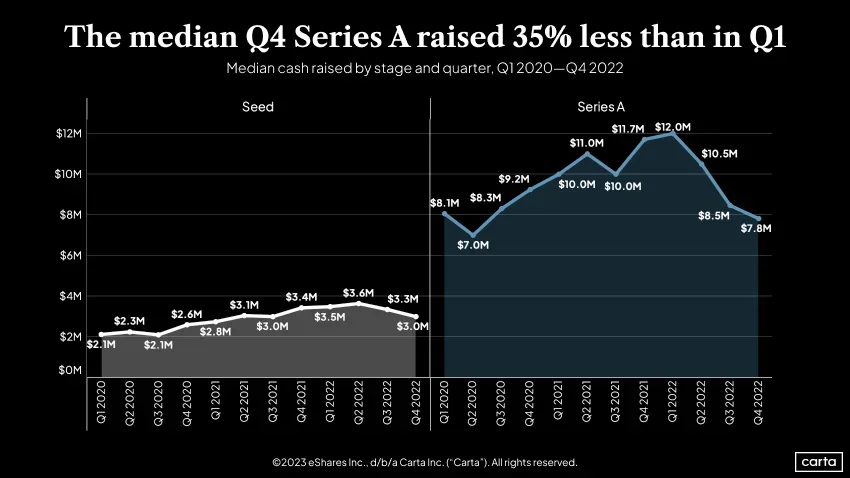 The median Q4 Series A raised 35% less than in Q1Carta Data · February 2023
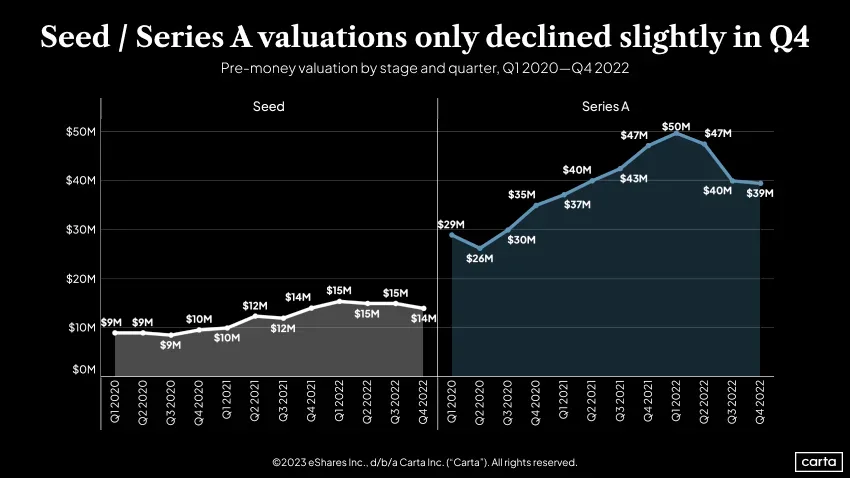 Seed / Series A valuations only declined slightly in Q4Carta Data · February 2023
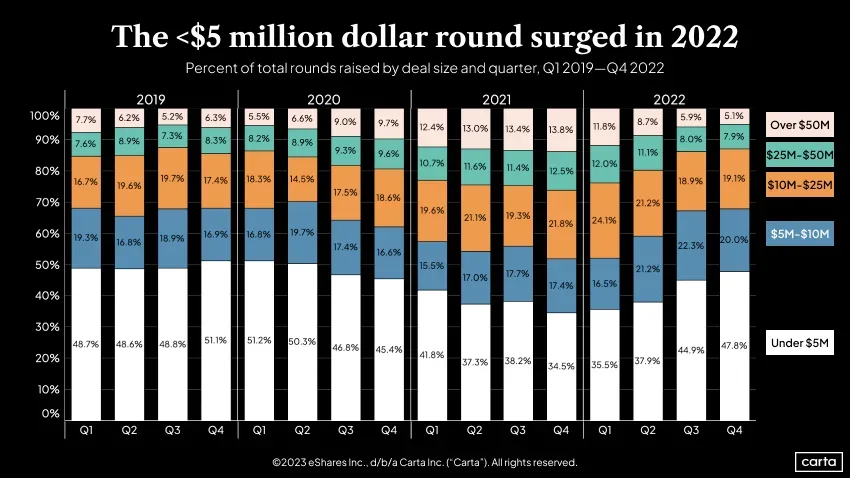 The <$5 million dollar round surged in 2022Carta Data · February 2023
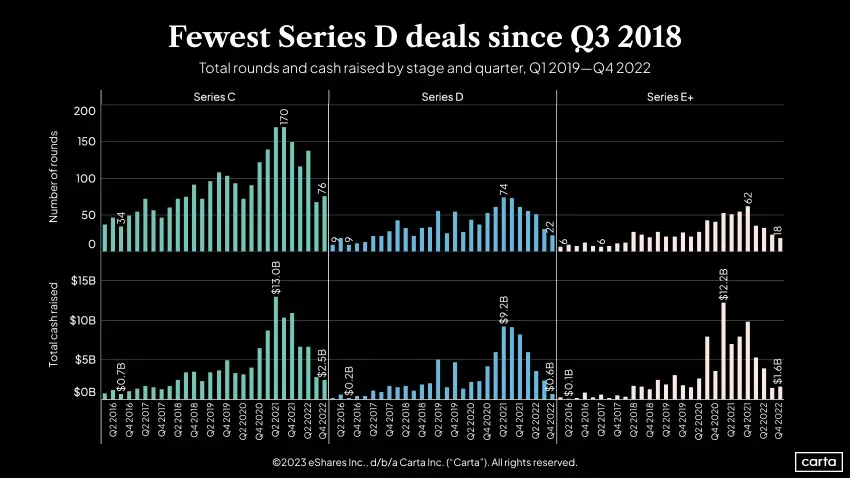 Fewest Series D deals since Q3 2018Carta Data · February 2023
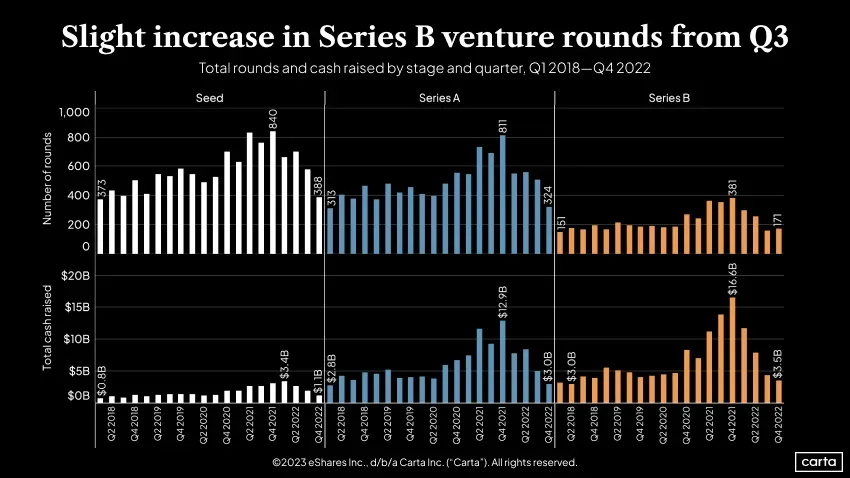 Slight increase in Series B venture rounds from Q3Carta Data · February 2023
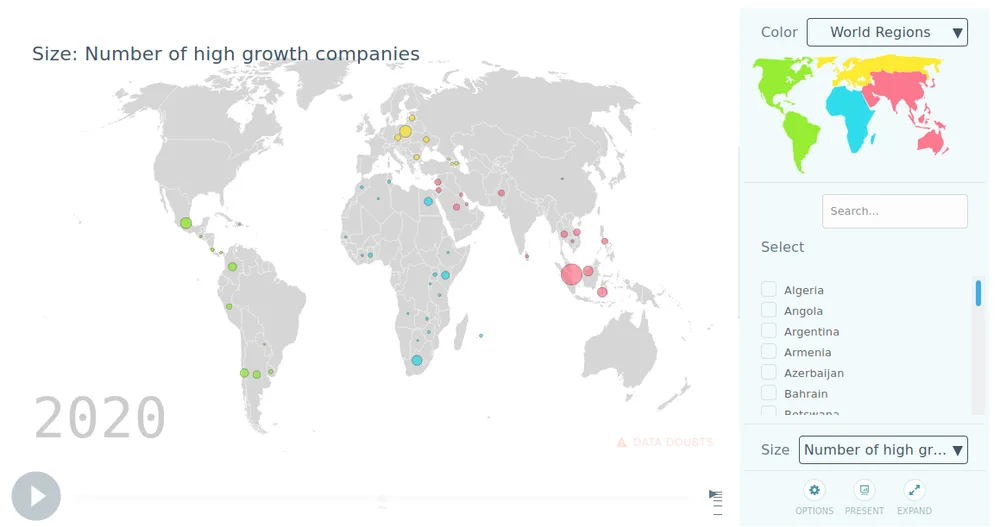 Number of high growth companiesSeedstars · December 2020
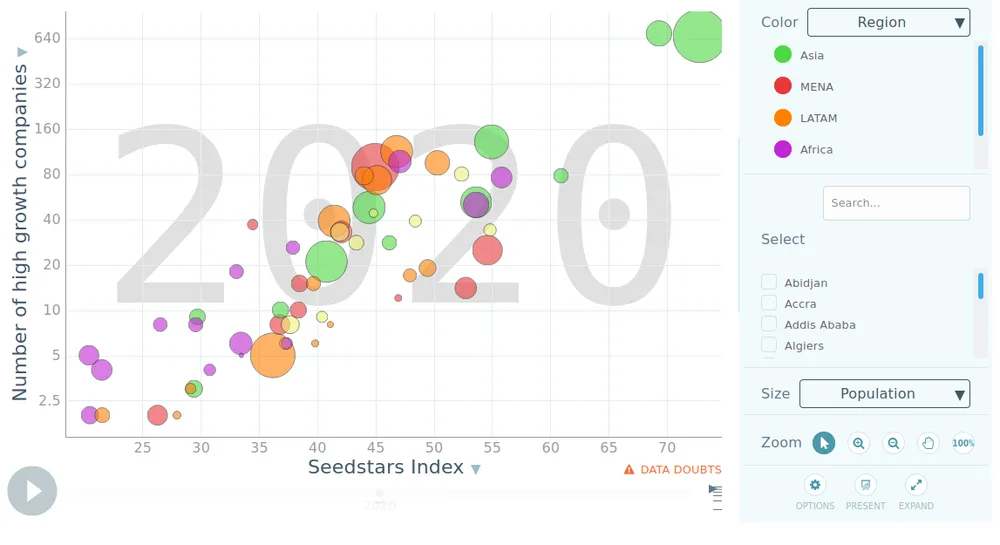 Number of High Growth Companies vs. Seedstars IndexSeedstars · December 2020
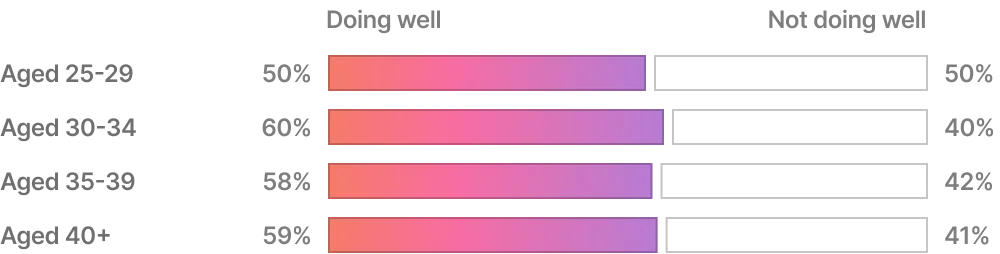 Founder performance by age groupBasis Set Ventures
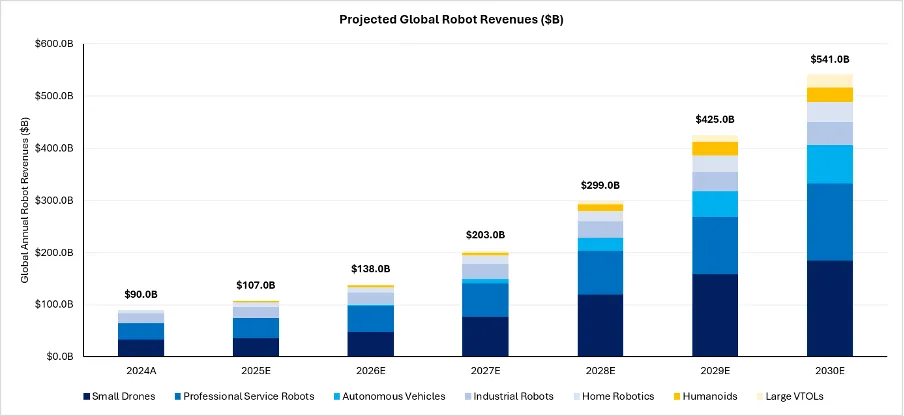 Projected Global Robot Revenues ($B)Sapphire Ventures
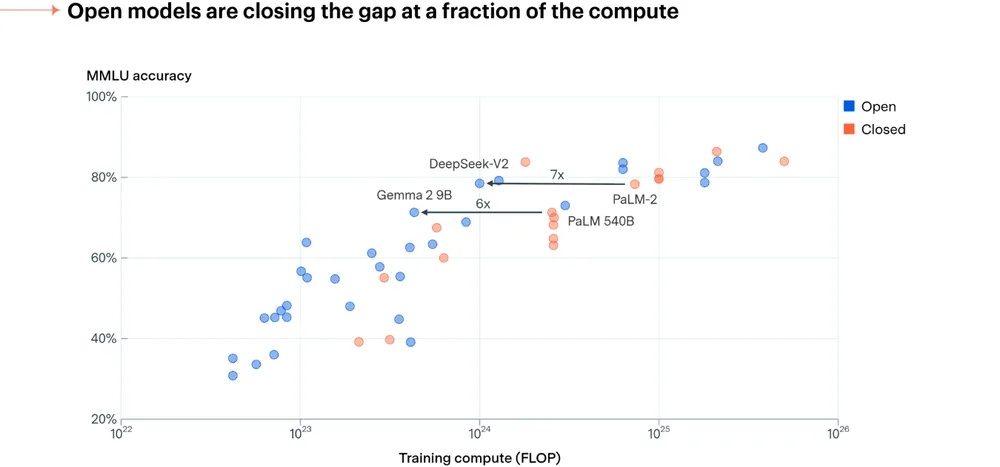 Open models are closing the gap at a fraction of the computeNew Enterprise Associates
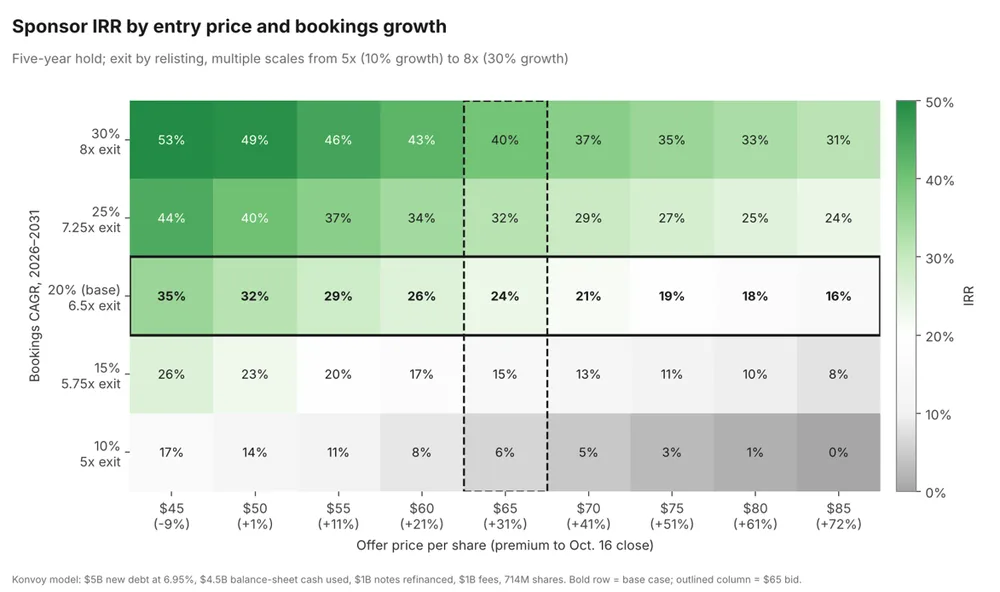 Sponsor IRR by entry price and bookings growthKonvoy Ventures
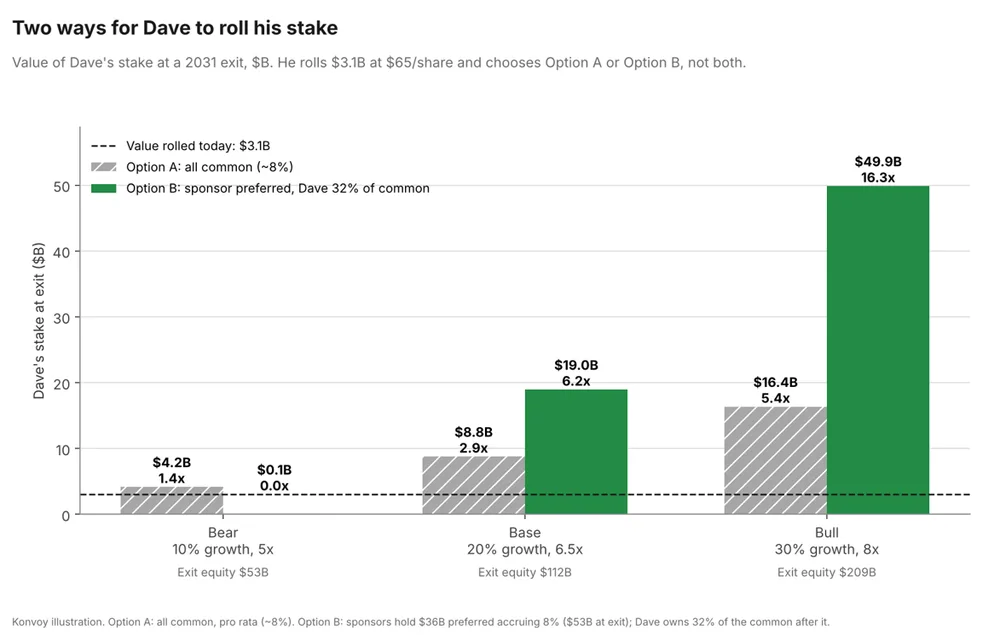 Two ways for Dave to roll his stakeKonvoy Ventures
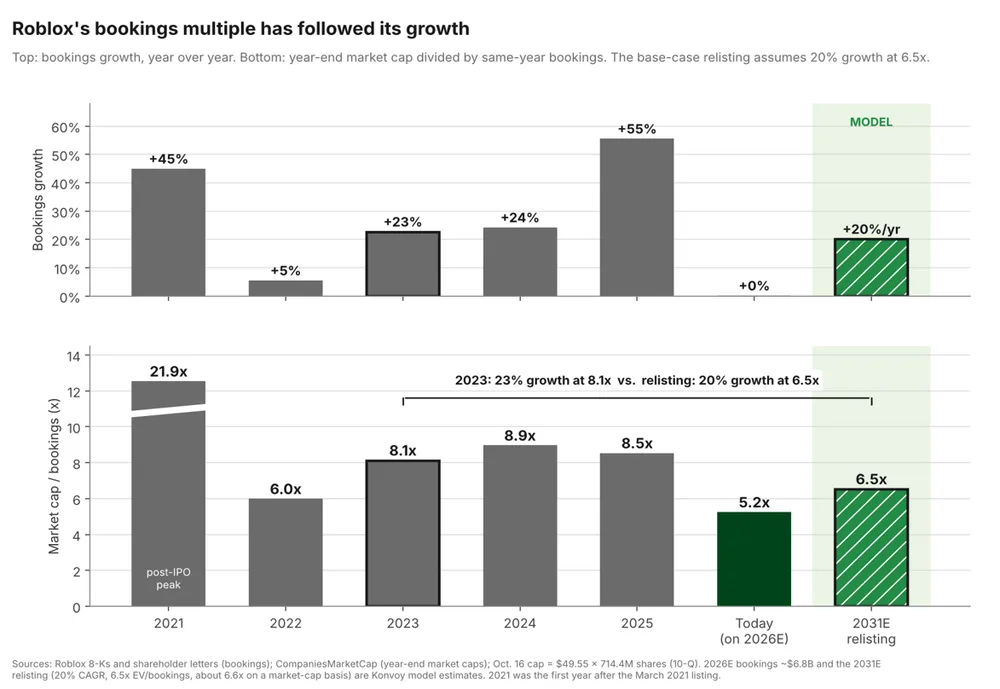 Roblox's bookings multiple has followed its growthKonvoy Ventures
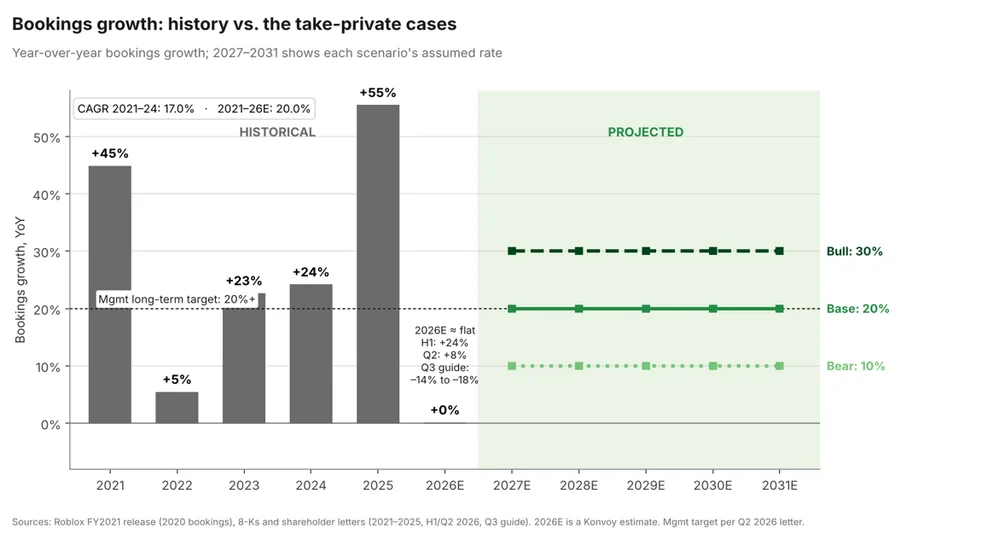 Bookings growth: history vs. the take-private casesKonvoy Ventures