Past valuations do not predict future results
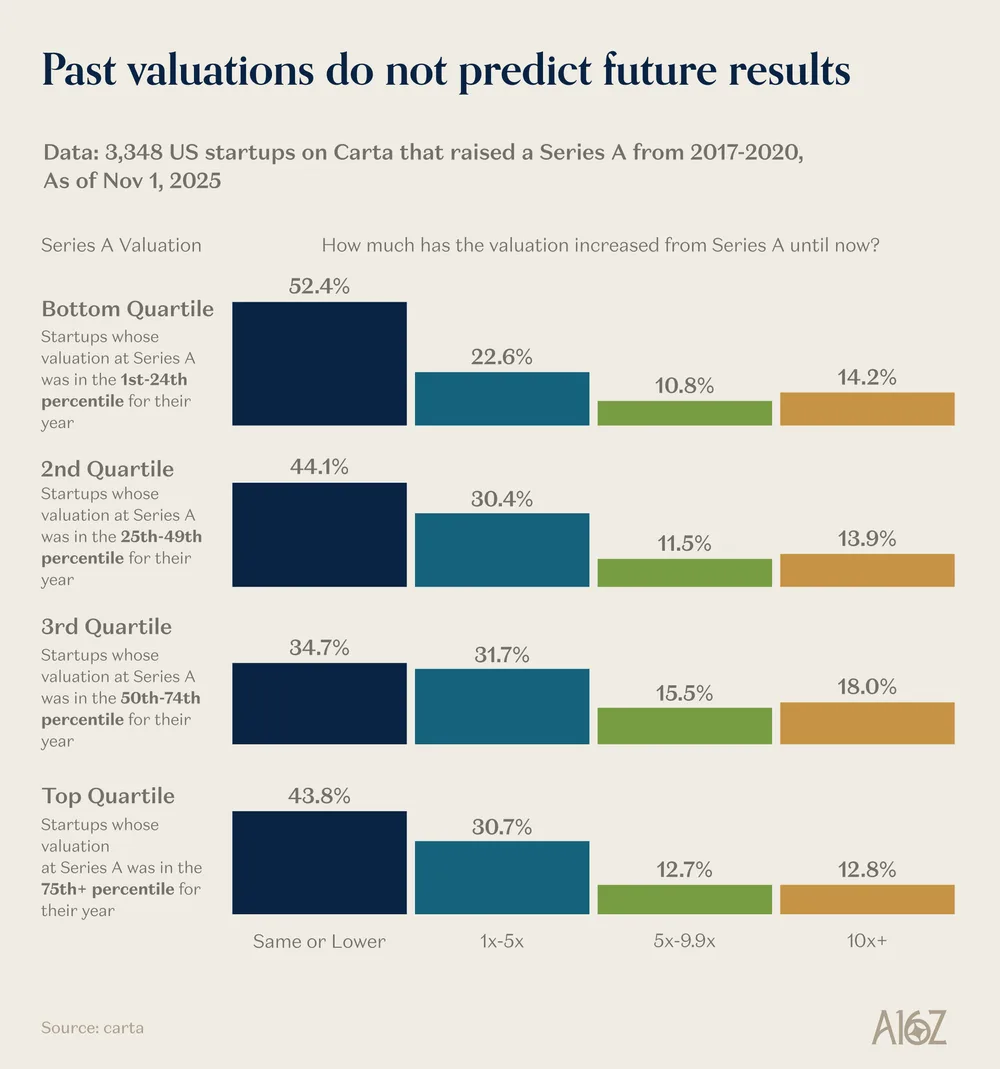
Chart analyzing 3,348 US startups that raised a Series A between 2017 and 2020 to measure valuation increases as of November 2025. It demonstrates that initial Series A valuation quartiles do not reliably predict future valuation growth multiples.
| Label | Value shown on the chart |
|---|---|
| Bottom Quartile - Same or Lower | 52.4% |
| Bottom Quartile - 1x-5x | 22.6% |
| Bottom Quartile - 5x-9.9x | 10.8% |
| Bottom Quartile - 10x filtration | 14.2% |
| 2nd Quartile - Same or Lower | 44.1% |
| 2nd Quartile - 1x-5x | 30.4% |
| 3rd Quartile - Same or Lower | 34.7% |
| 3rd Quartile - 1x-5x | 31.7% |
| Top Quartile - Same or Lower | 43.8% |
| Top Quartile - 1x-5x | 30.7% |
| Top Quartile - 5x-9.9x | 12.7% |
| Top Quartile - 10x filtration | 12.8% |
Shown as a preview with credit and a link to the original. Publishers can request removal.
View the original on a16z.news