Infrastructure software trades at a premium.
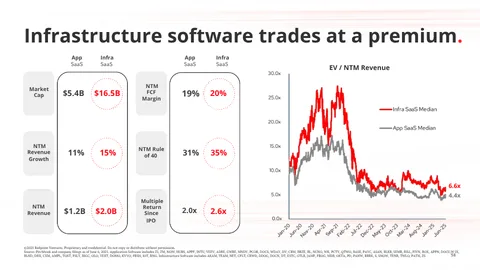
Comparison of fundamental metrics and EV / NTM Revenue multiples between App SaaS and Infra SaaS from 2020 to 2025, highlighting higher valuations and growth for Infrastructure software.
| Label | Value shown on the chart |
|---|---|
| Market Cap (App SaaS) | $5.4B |
| Market Cap (Infra SaaS) | $16.5B |
| NTM Revenue Growth (App SaaS) | 11% |
| NTM Revenue Growth (Infra SaaS) | 15% |
| NTM Revenue (App SaaS) | $1.2B |
| NTM Revenue (Infra SaaS) | $2.0B |
| NTM FCF Margin (App SaaS) | 19% |
| NTM FCF Margin (Infra SaaS) | 20% |
| NTM Rule of 40 (App SaaS) | 31% |
| NTM Rule of 40 (Infra SaaS) | 35% |
| Infra SaaS Median Multiple (Jun-25) | 6.6x |
| App SaaS Median Multiple (Jun-25) | 4.4x |
Shown as a preview with credit and a link to the original. Publishers can request removal.
View the original on redpoint.com