Charts / 0100 Conferences (newsletter)
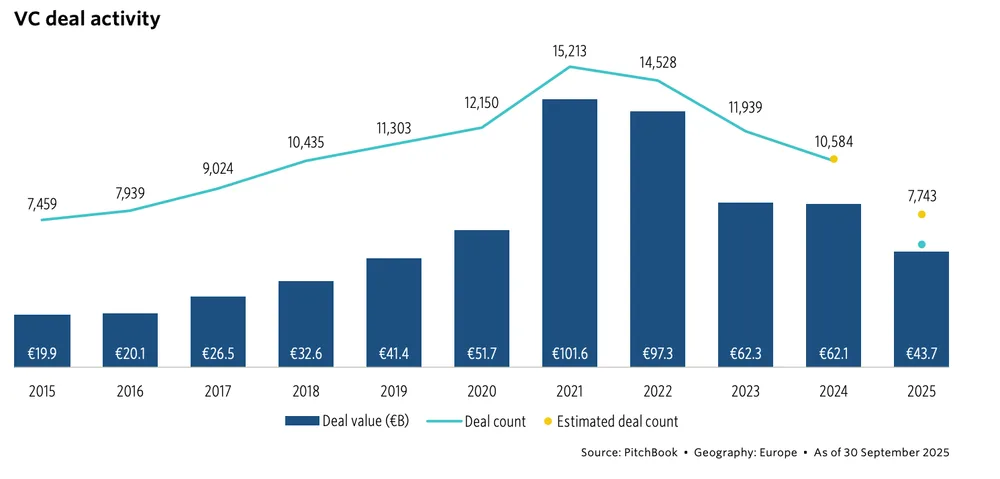
Total capital invested ($B) in Europe, 2016 to 2025
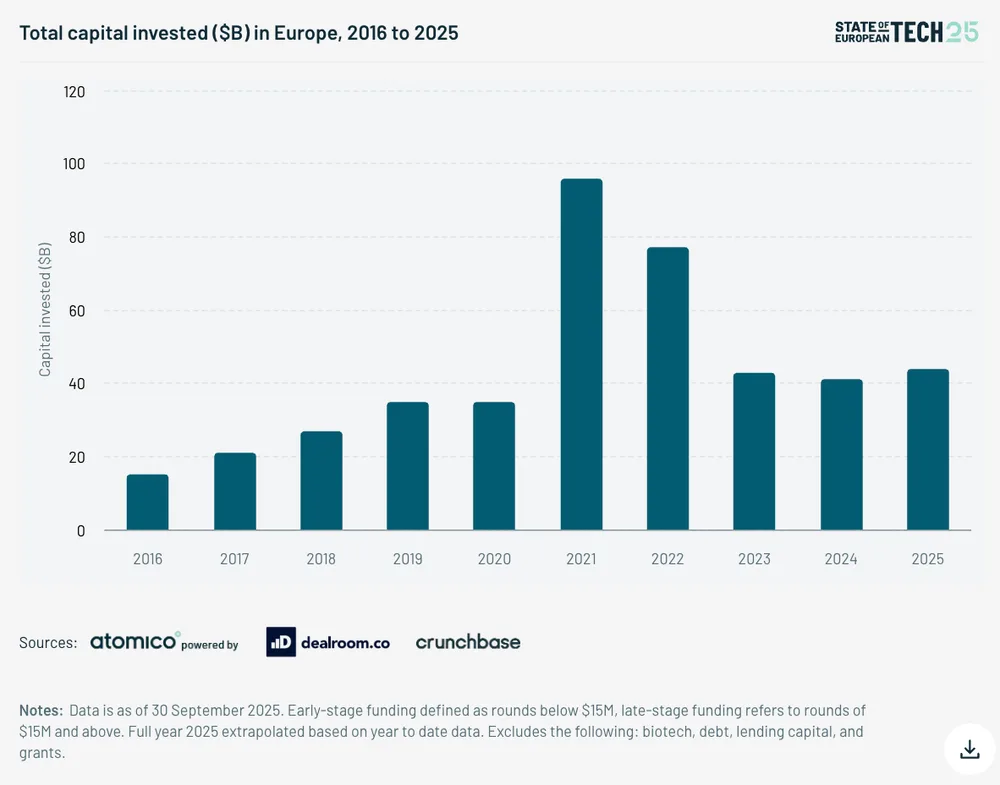
A bar chart displaying total capital invested in European tech from 2016 to 2025 in billions of US dollars. Investment peaked significantly in 2021 near $100B before settling into a steady range around $40B-$45B between 2023 and 2025.
Shown as a preview with credit and a link to the original. Publishers can request removal.
View the original on 0100conferences.substack.com