Charts
Data charts published by VCs, investors and analysts in their articles and newsletters. Each links to its source.
343 charts
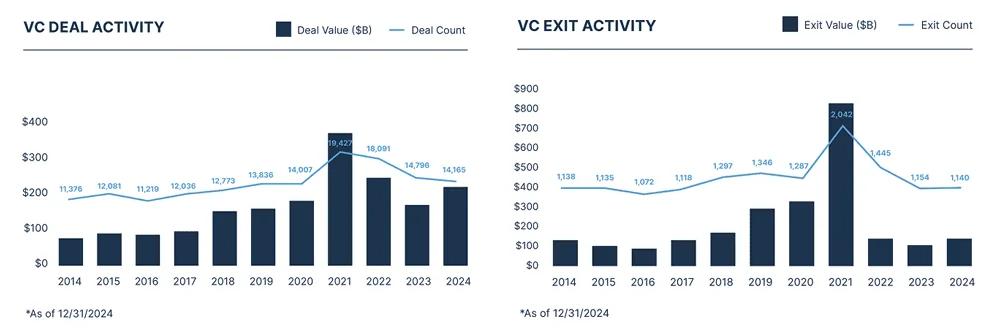 VC Deal Activity and VC Exit ActivityRunway Growth Capital · May 2026
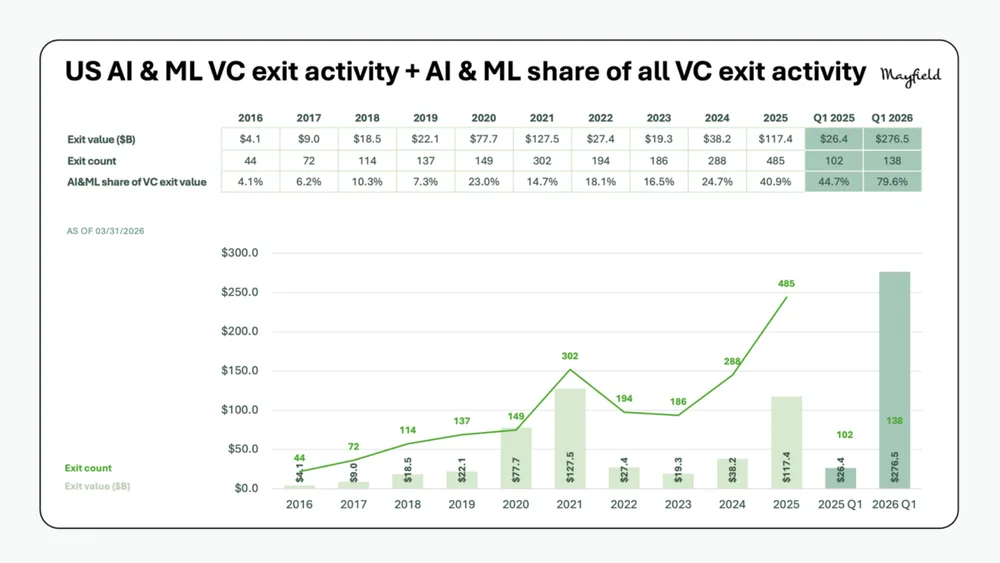 US AI & ML VC exit activity + AI & ML share of all VC exit activityMayfield Fund · April 2026
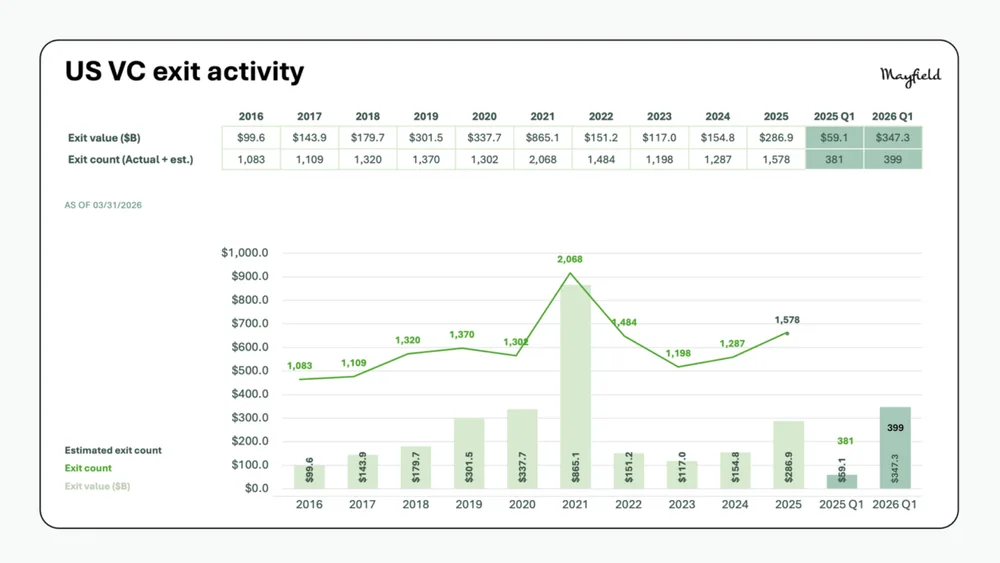 US VC exit activityMayfield Fund · April 2026
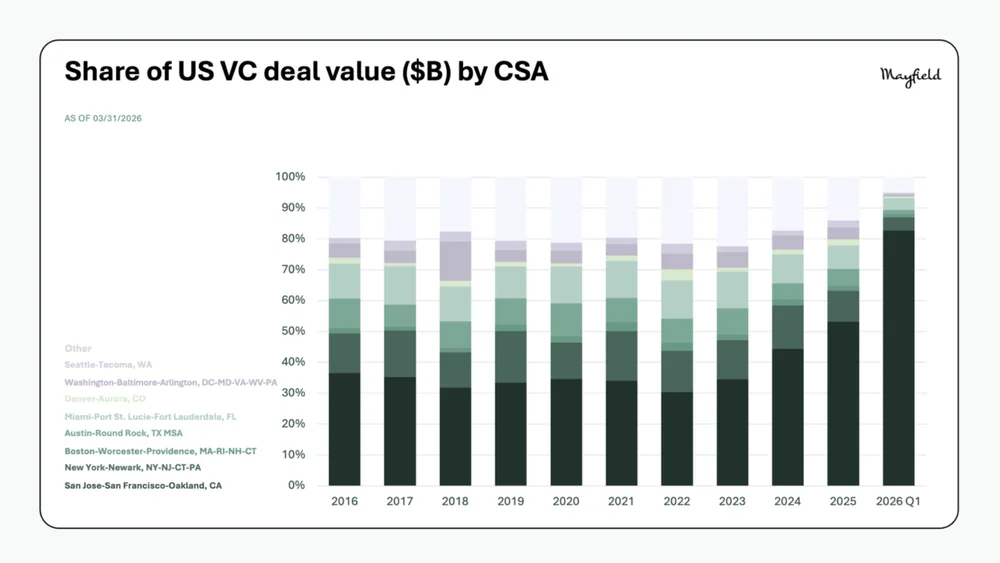 Share of US VC deal value ($B) by CSAMayfield Fund · April 2026
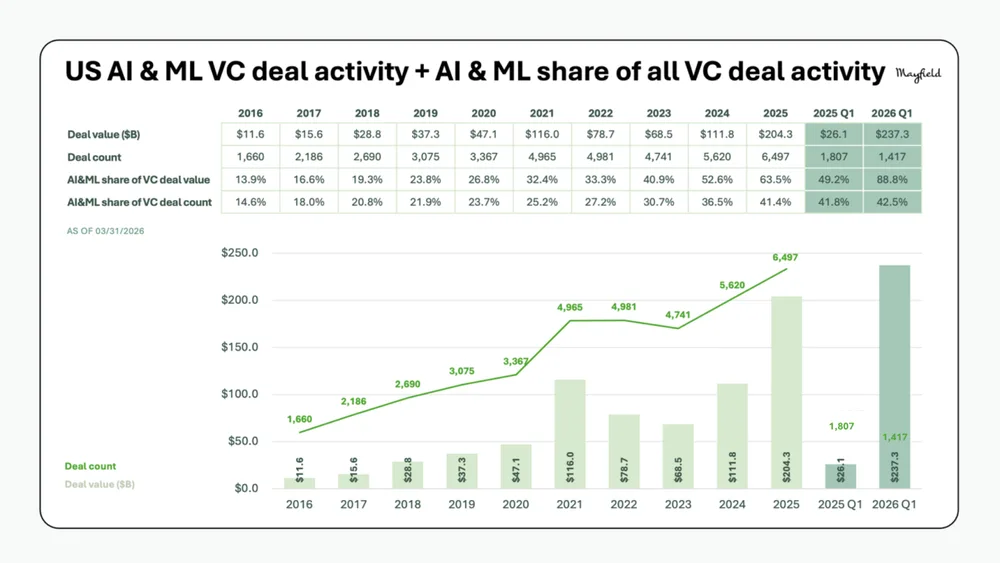 US AI & ML VC deal activity + AI & ML share of all VC deal activityMayfield Fund · April 2026
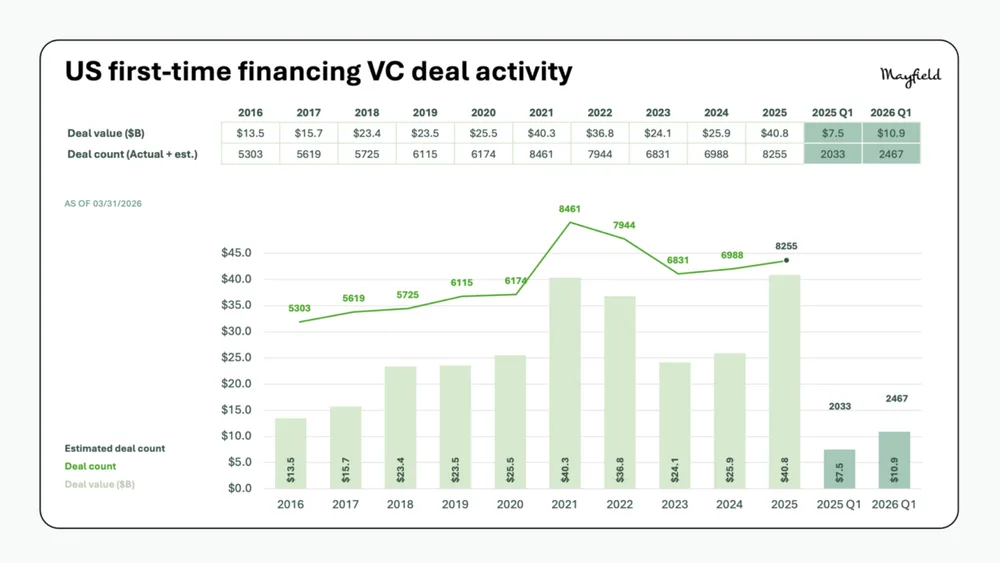 US first-time financing VC deal activityMayfield Fund · April 2026
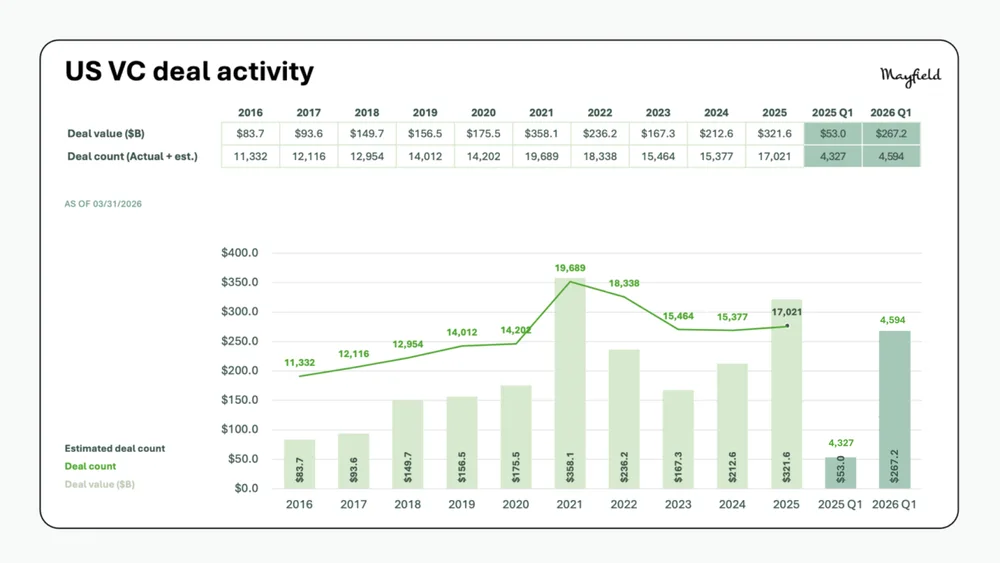 US VC deal activityMayfield Fund · April 2026
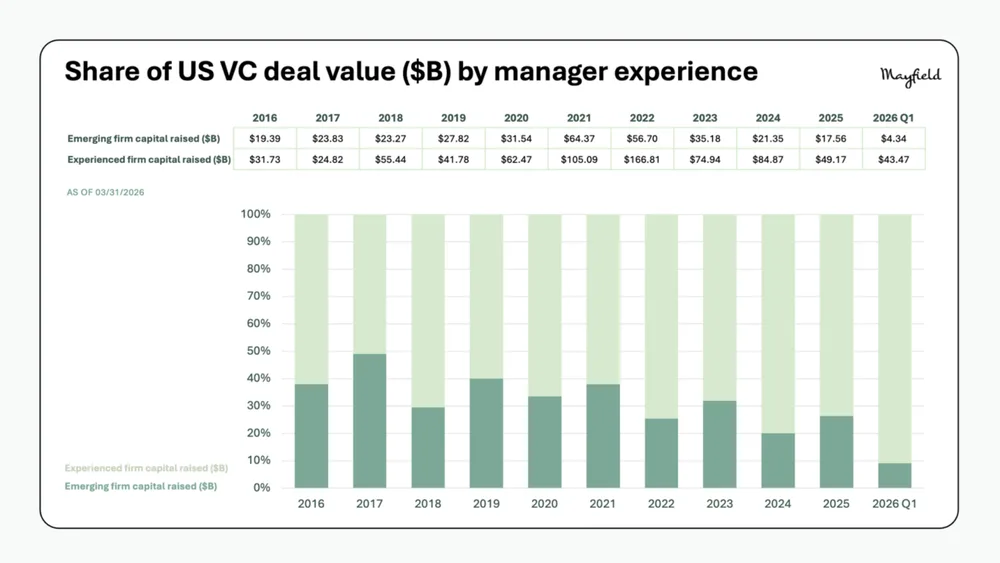 Share of US VC deal value ($B) by manager experienceMayfield Fund · April 2026
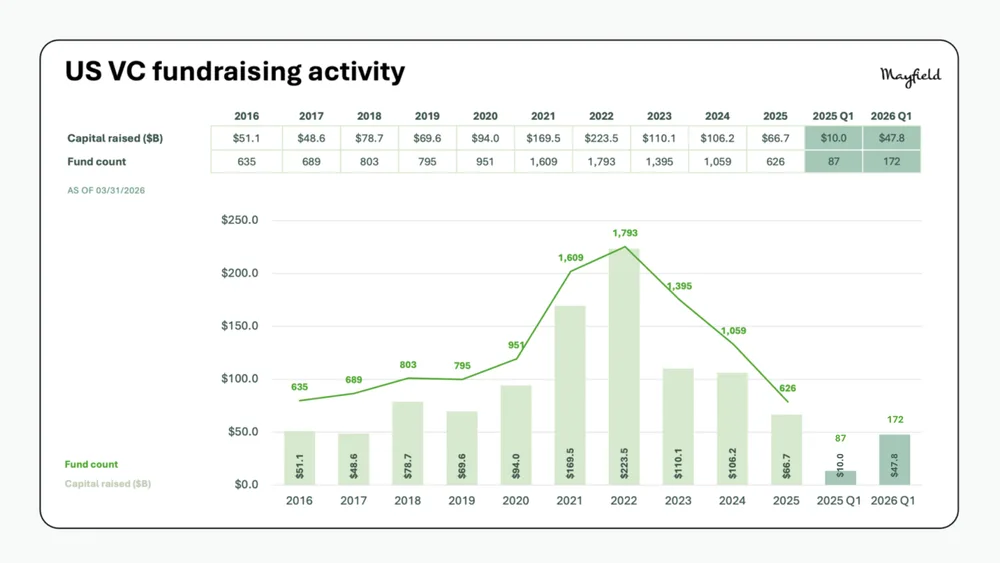 US VC fundraising activityMayfield Fund · April 2026
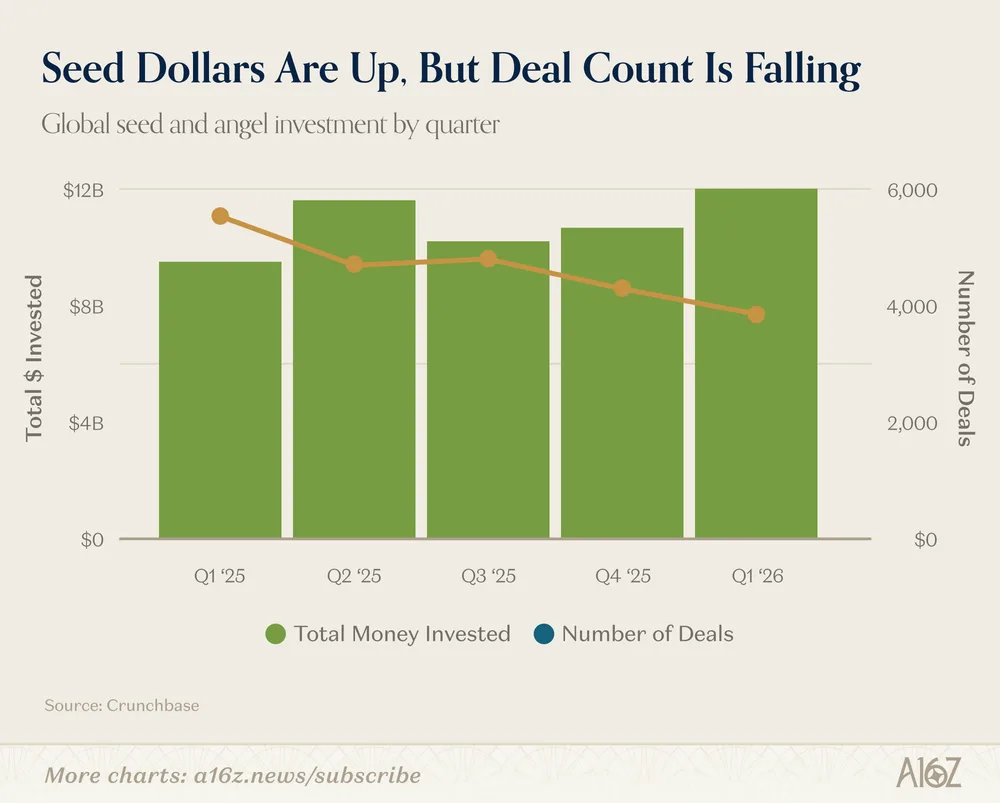 Seed Dollars Are Up, But Deal Count Is Fallinga16z News · April 2026
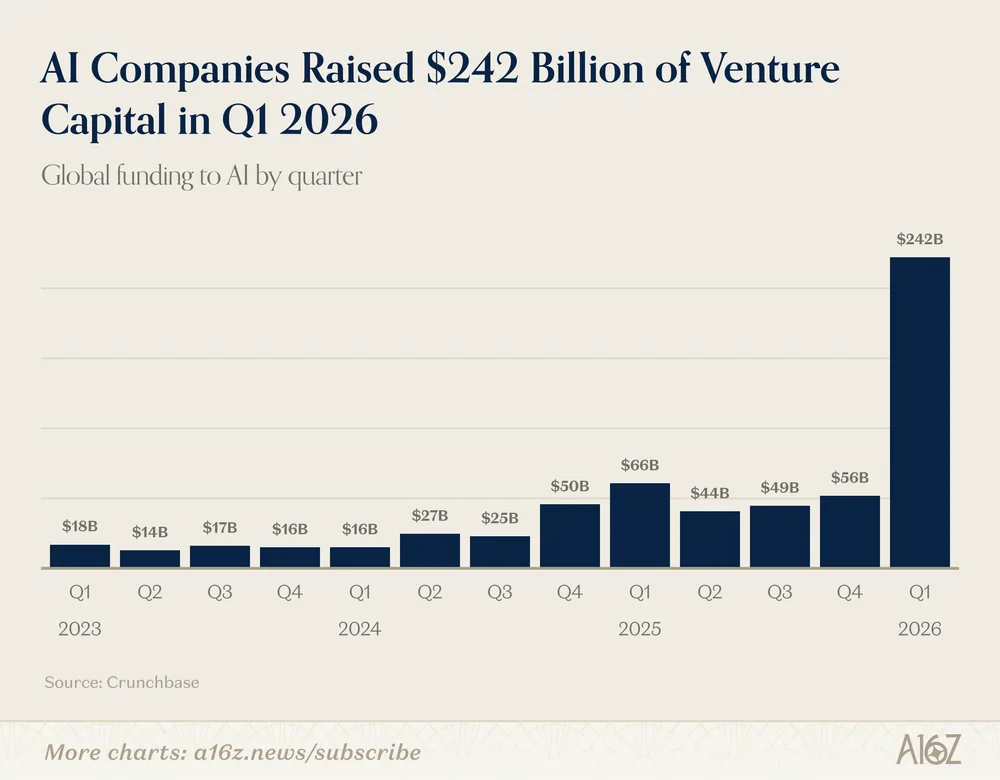 AI Companies Raised $242 Billion of Venture Capital in Q1 2026a16z News · April 2026
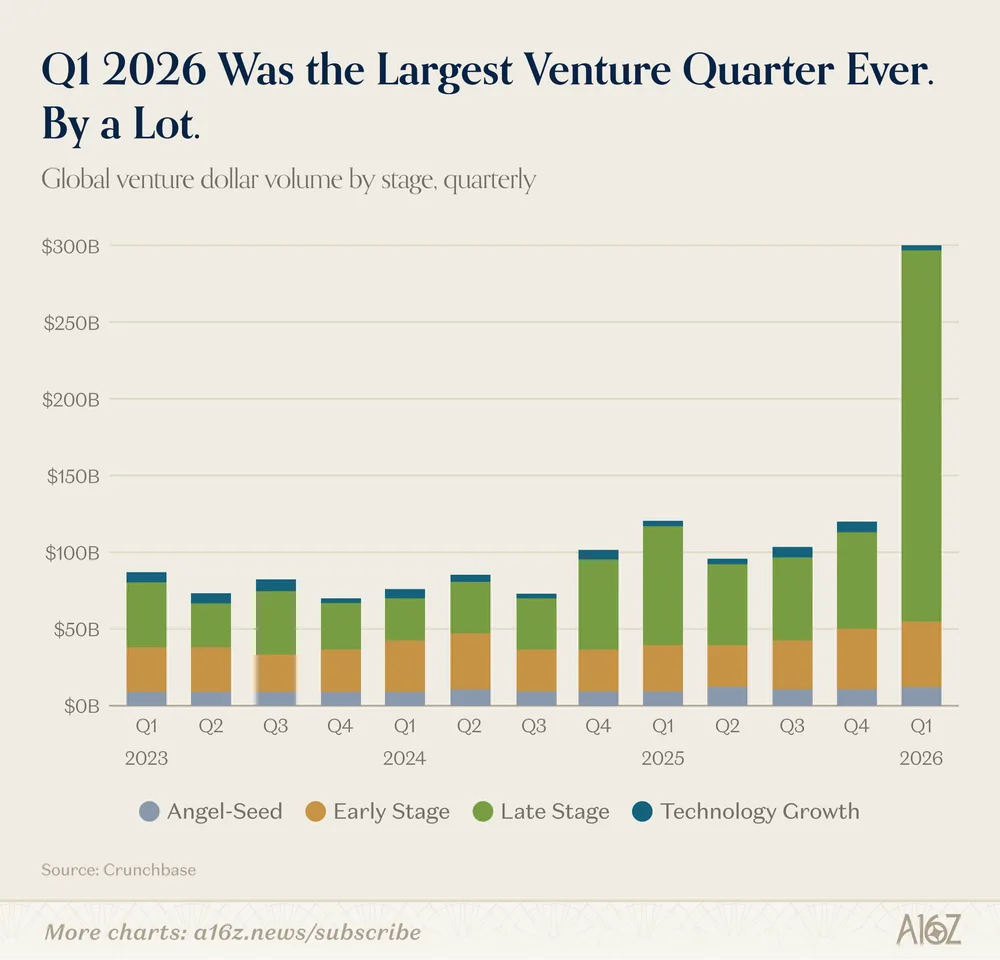 Q1 2026 Was the Largest Venture Quarter Ever. By a Lot.a16z News · April 2026
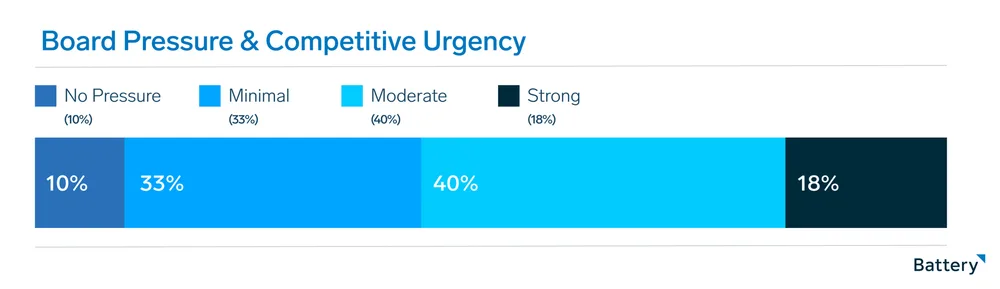 Board Pressure & Competitive UrgencyBattery Ventures · April 2026
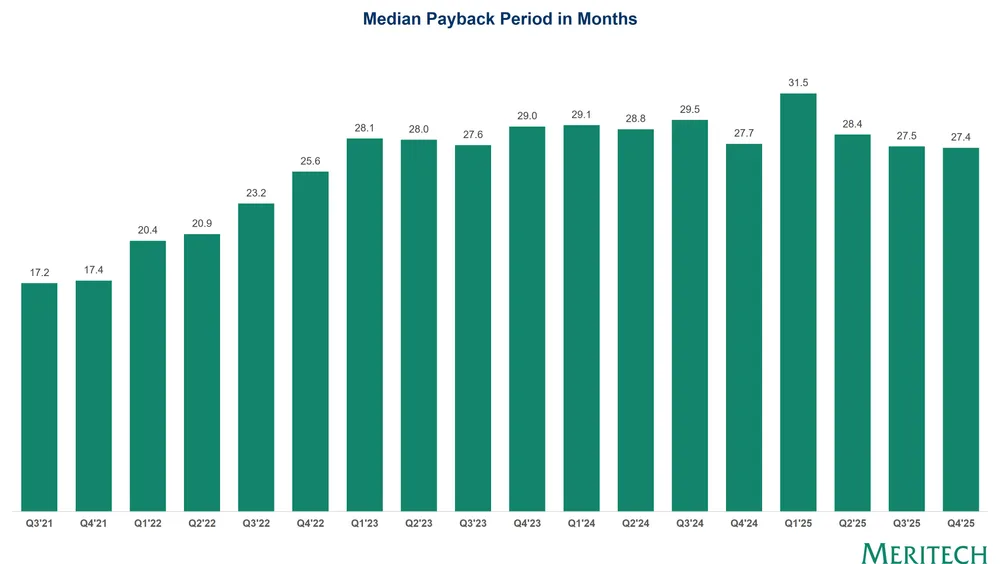 Median Payback Period in MonthsMeritech Capital · March 2026
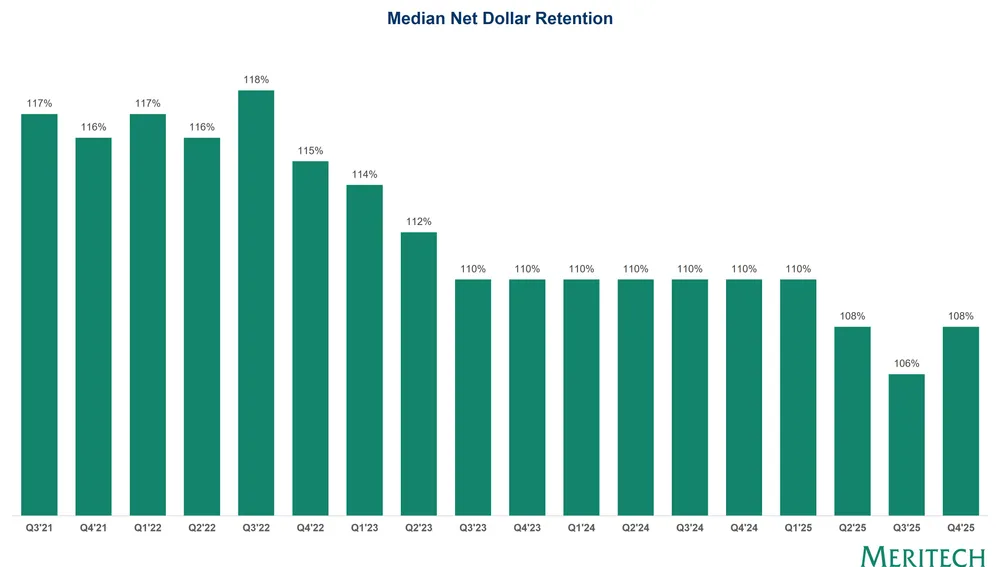 Median Net Dollar RetentionMeritech Capital · March 2026
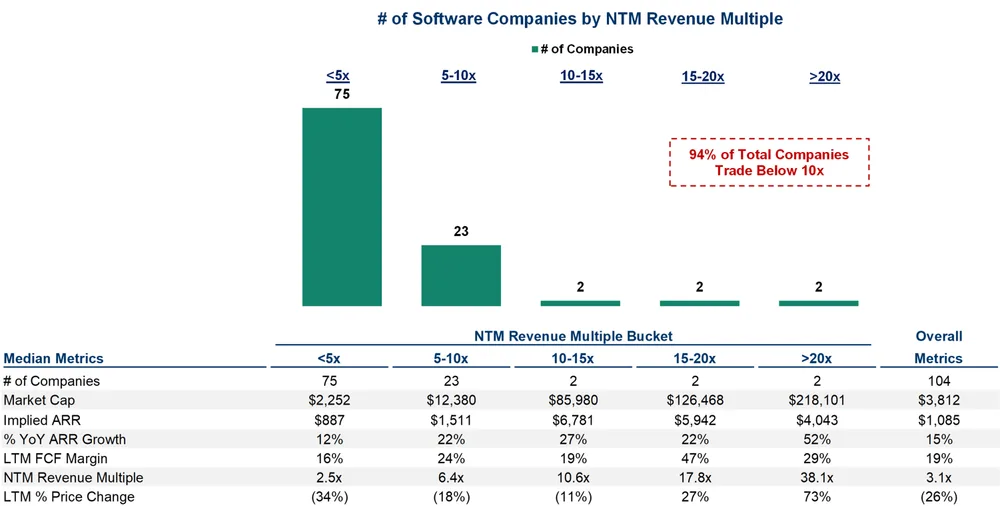 # of Software Companies by NTM Revenue MultipleMeritech Capital · March 2026
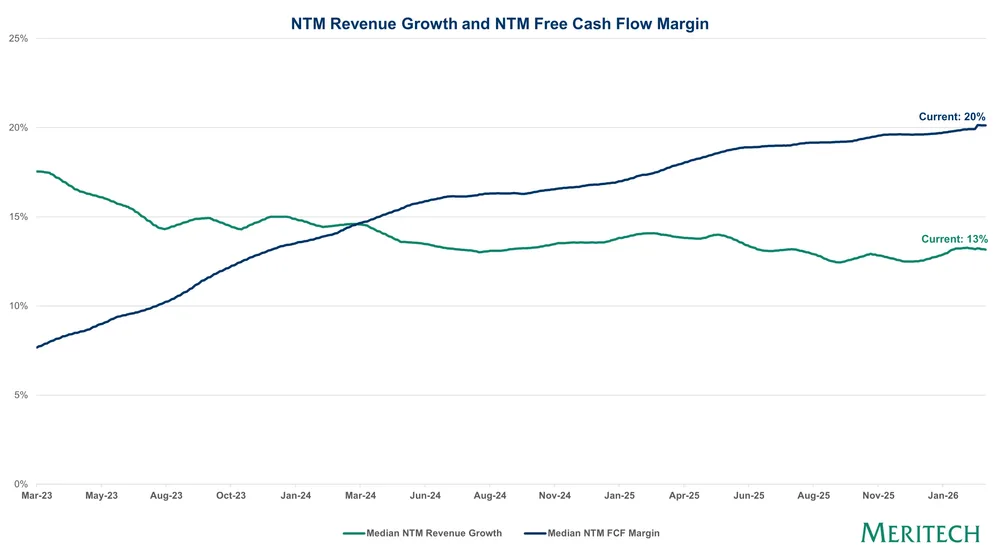 NTM Revenue Growth and NTM Free Cash Flow MarginMeritech Capital · March 2026
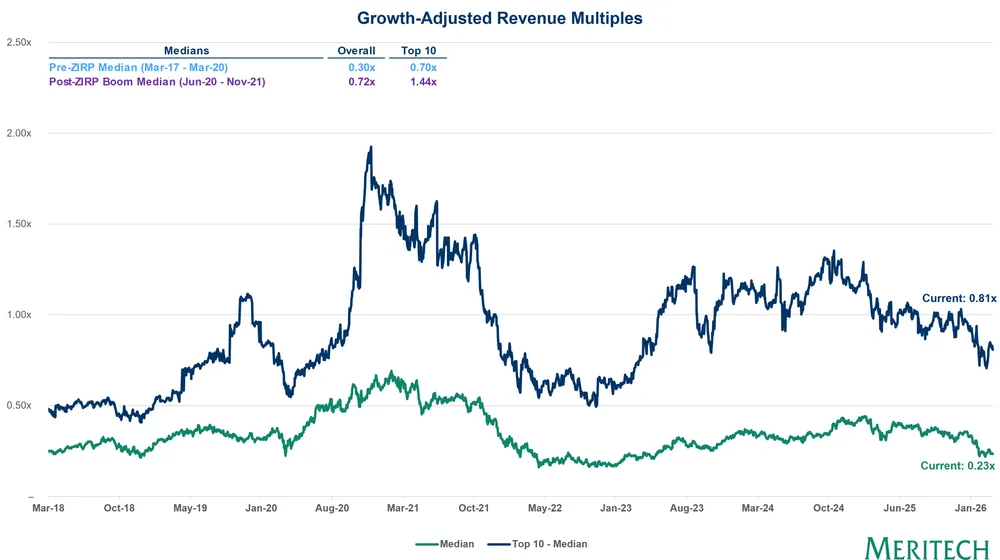 Growth-Adjusted Revenue MultiplesMeritech Capital · March 2026
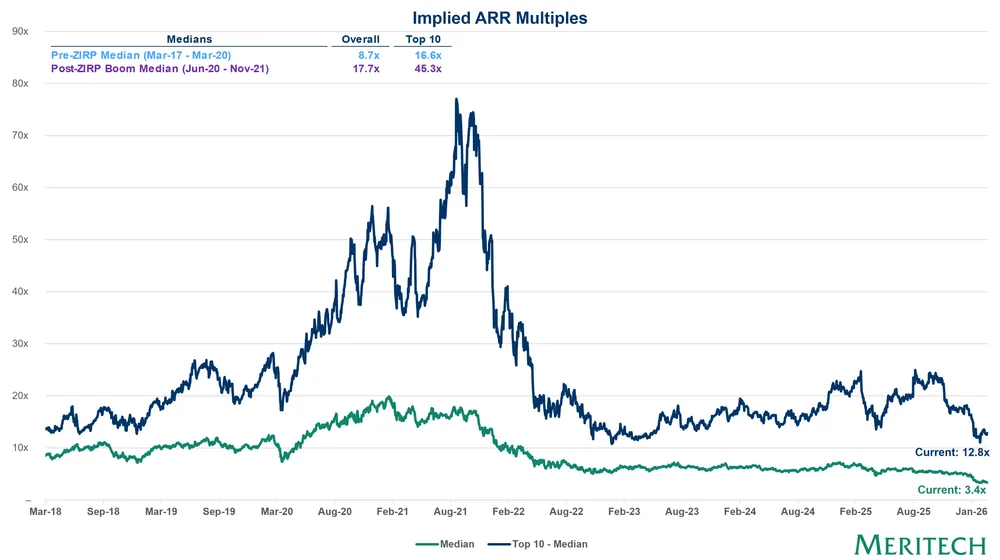 Implied ARR MultiplesMeritech Capital · March 2026
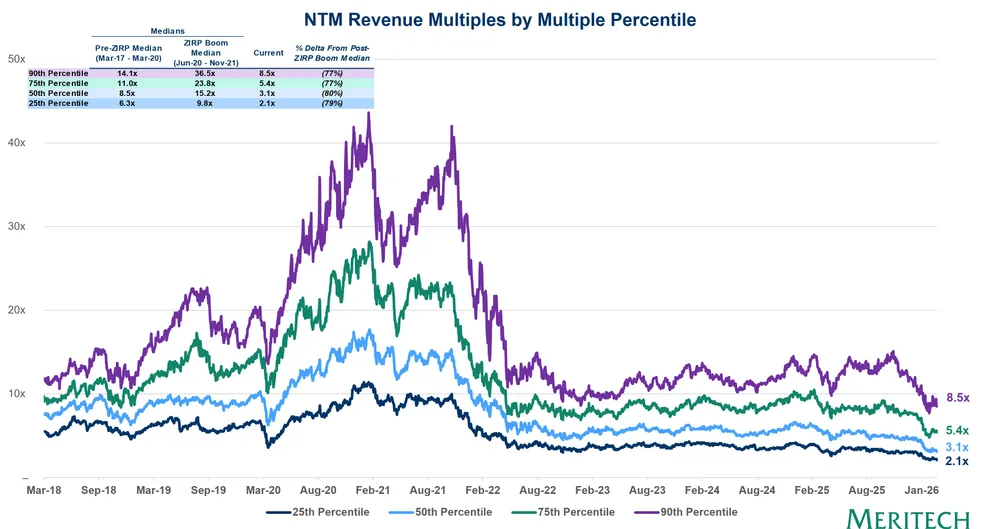 NTM Revenue Multiples by Multiple PercentileMeritech Capital · March 2026
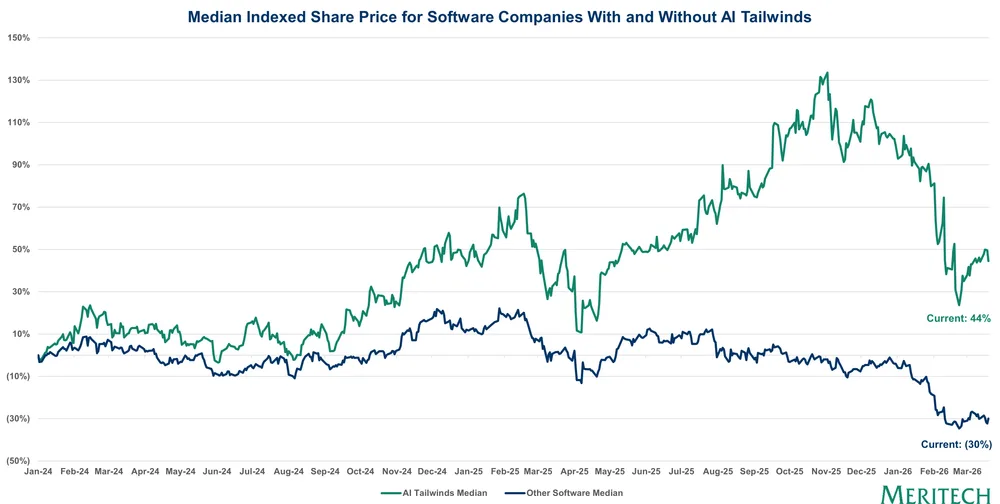 Median Indexed Share Price for Software Companies With and Without AI TailwindsMeritech Capital · March 2026
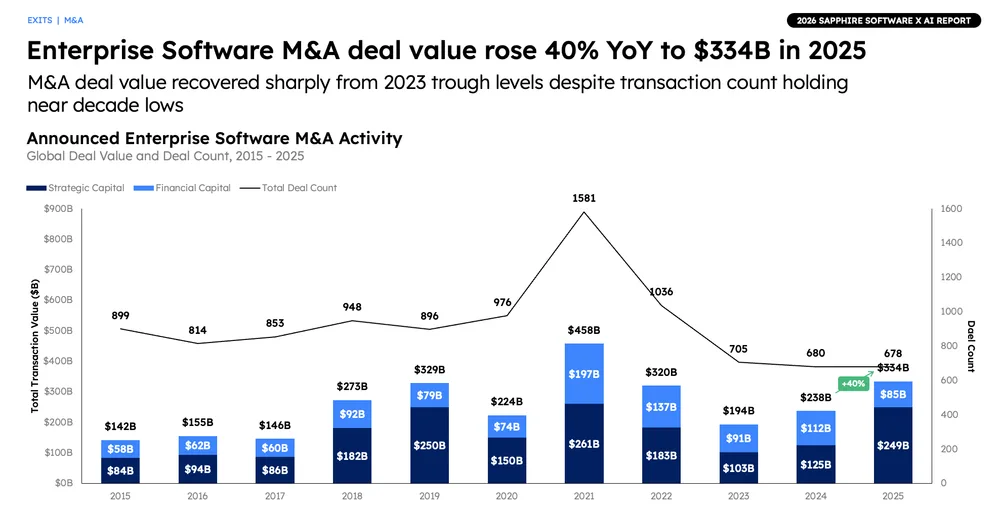 Enterprise Software M&A deal value rose 40% YoY to $334B in 2025Sapphire Ventures · March 2026
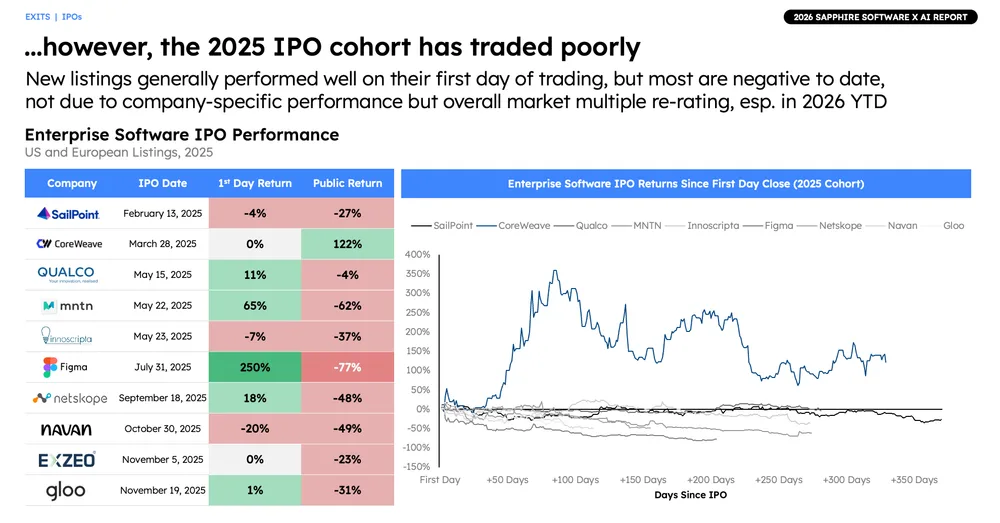 Enterprise Software IPO PerformanceSapphire Ventures · March 2026
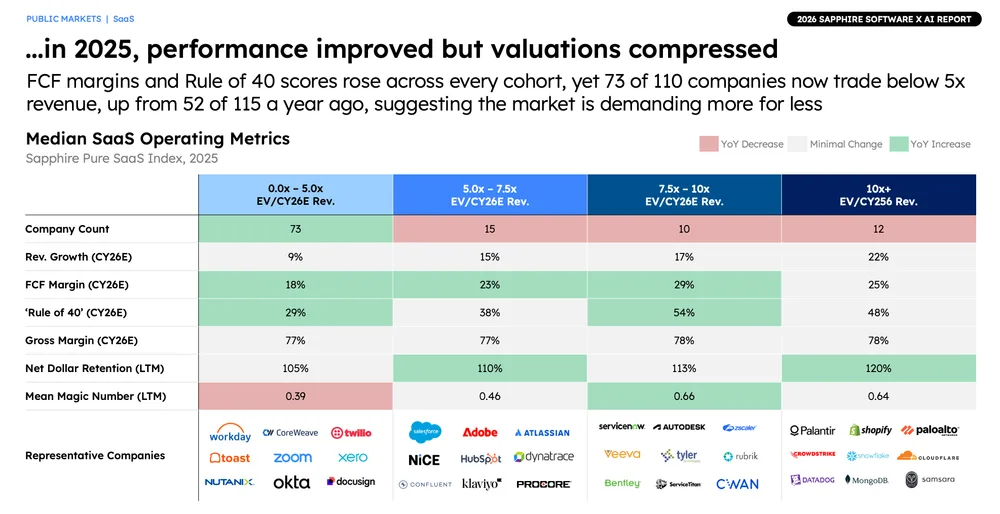 Median SaaS Operating MetricsSapphire Ventures · March 2026