NTM Revenue Multiples by Multiple Percentile
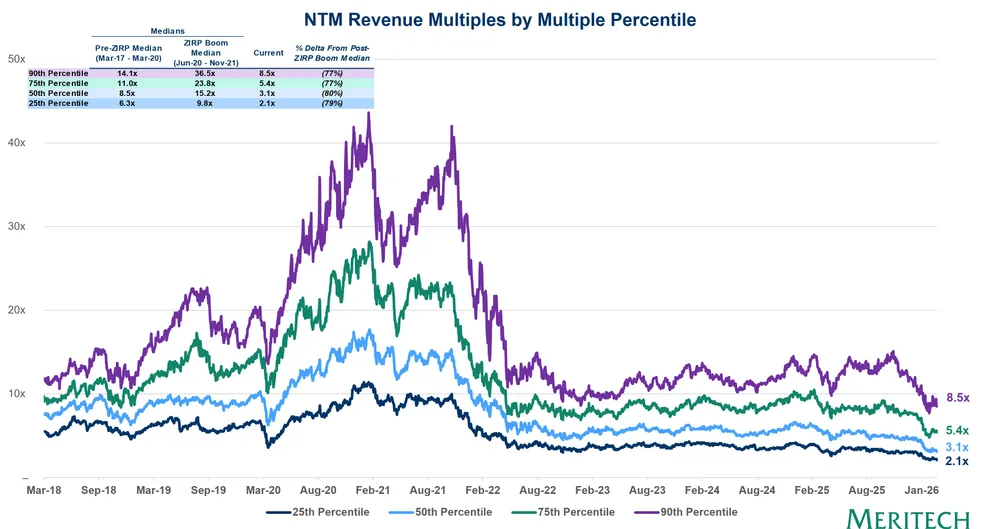
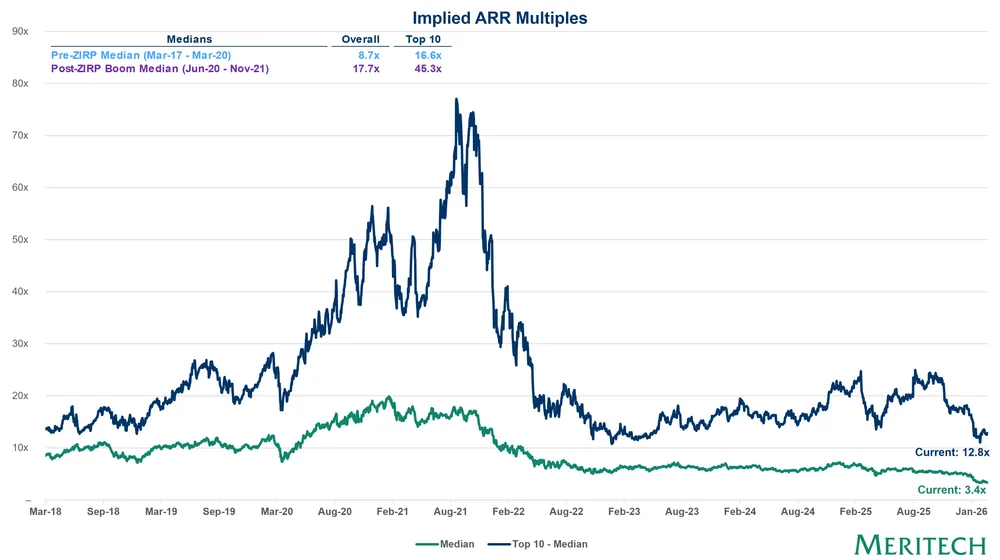
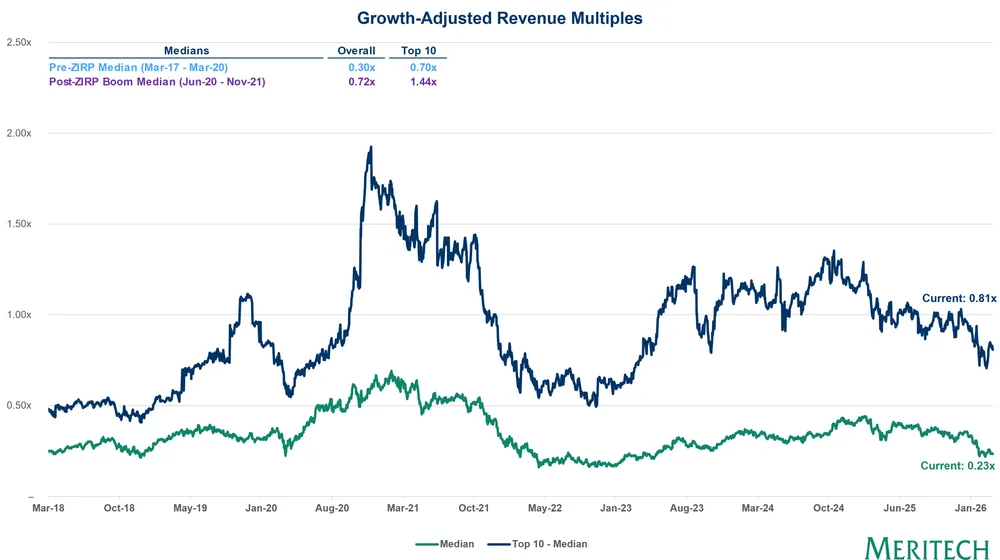
This chart shows Enterprise Value to Next Twelve Months (NTM) revenue multiples by percentile for public software companies from March 2018 to January 2026. Software valuations spiked during the ZIRP boom before declining significantly, with current median (50th percentile) NTM revenue multiples sitting at 3.1x.
| Label | Value shown on the chart |
|---|---|
| 90th Percentile Current | 8.5x |
| 75th Percentile Current | 5.4x |
| 50th Percentile Current | 3.1x |
| 25th Percentile Current | 2.1x |
| 90th Percentile Pre-ZIRP Median | 14.1x |
| 75th Percentile Pre-ZIRP Median | 11.0x |
| 50th Percentile Pre-ZIRP Median | 8.5x |
| 25th Percentile Pre-ZIRP Median | 6.3x |
| 90th Percentile ZIRP Boom Median | 36.5x |
| 75th Percentile ZIRP Boom Median | 23.8x |
| 50th Percentile ZIRP Boom Median | 15.2x |
| 25th Percentile ZIRP Boom Median | 9.8x |
Shown as a preview with credit and a link to the original. Publishers can request removal.
View the original on meritech.substack.com