Median Net Dollar Retention
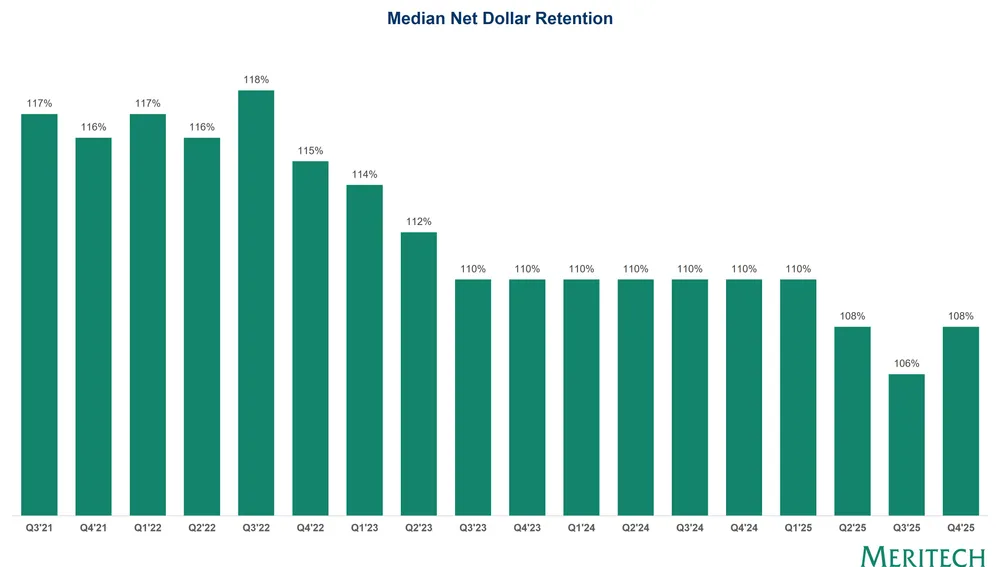
This bar chart tracks the median net dollar retention rate for public software companies from Q3 2021 to Q4 2025. It shows a continuous decline from a peak of 118% in Q3 2022 to around 106%-108% by 2025.
| Label | Value shown on the chart |
|---|---|
| Q3'21 | 117% |
| Q4'21 | 116% |
| Q1'22 | 117% |
| Q2'22 | 116% |
| Q3'22 | 118% |
| Q4'22 | 115% |
| Q1'23 | 114% |
| Q2'23 | 112% |
| Q3'23 | 110% |
| Q4'23 | 110% |
| Q1'24 | 110% |
| Q2'24 | 110% |
Shown as a preview with credit and a link to the original. Publishers can request removal.
View the original on meritech.substack.com