Charts / Runway Growth Capital
VC Deal Activity and VC Exit Activity
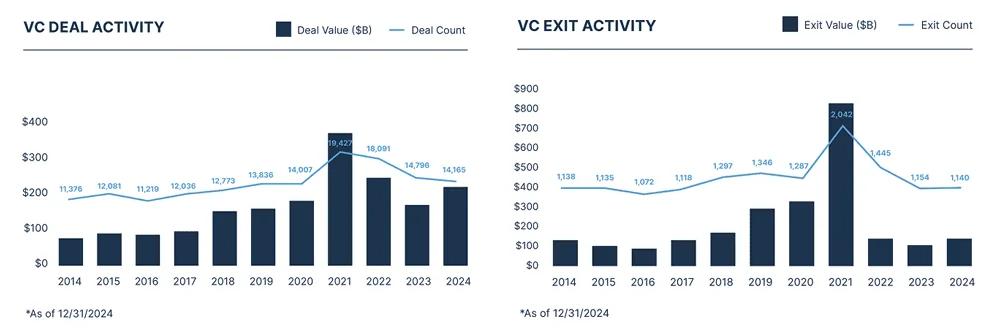
Two charts detailing venture capital deal activity and exit activity from 2014 to 2024, displaying annual deal/exit values in billions alongside total deal and exit counts. Activity peaked sharply in 2021 before moderating through 2024.
| Label | Value shown on the chart |
|---|---|
| 2014 Deal Count | 11,376 |
| 2015 Deal Count | 12,081 |
| 2016 Deal Count | 11,219 |
| 2017 Deal Count | 12,036 |
| 2018 Deal Count | 12,773 |
| 2019 Deal Count | 13,836 |
| 2020 Deal Count | 14,007 |
| 2021 Deal Count | 19,427 |
| 2022 Deal Count | 18,091 |
| 2023 Deal Count | 14,796 |
| 2024 Deal Count | 14,165 |
| 2021 Exit Count | 2,042 |
Shown as a preview with credit and a link to the original. Publishers can request removal.
View the original on runwaygrowth.com