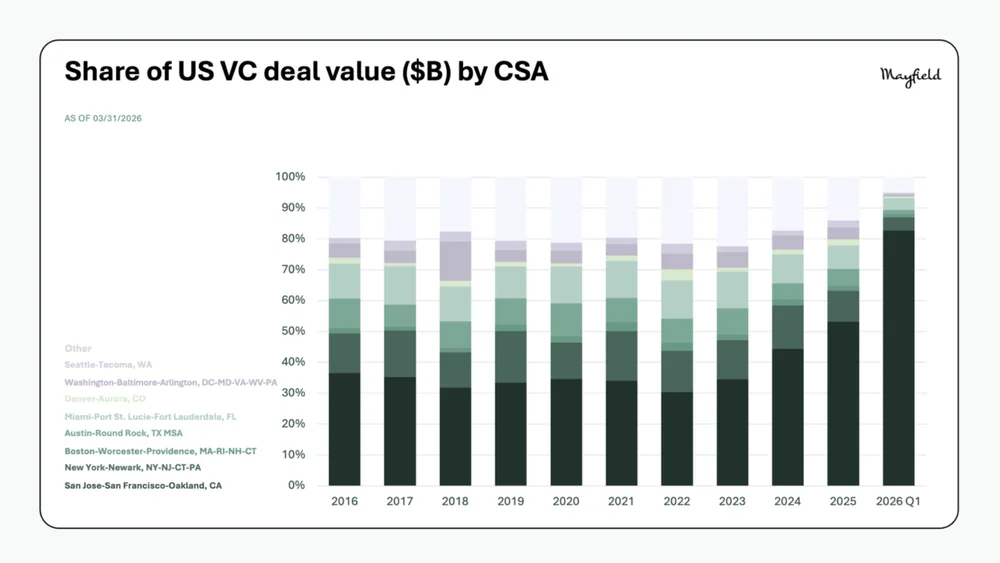
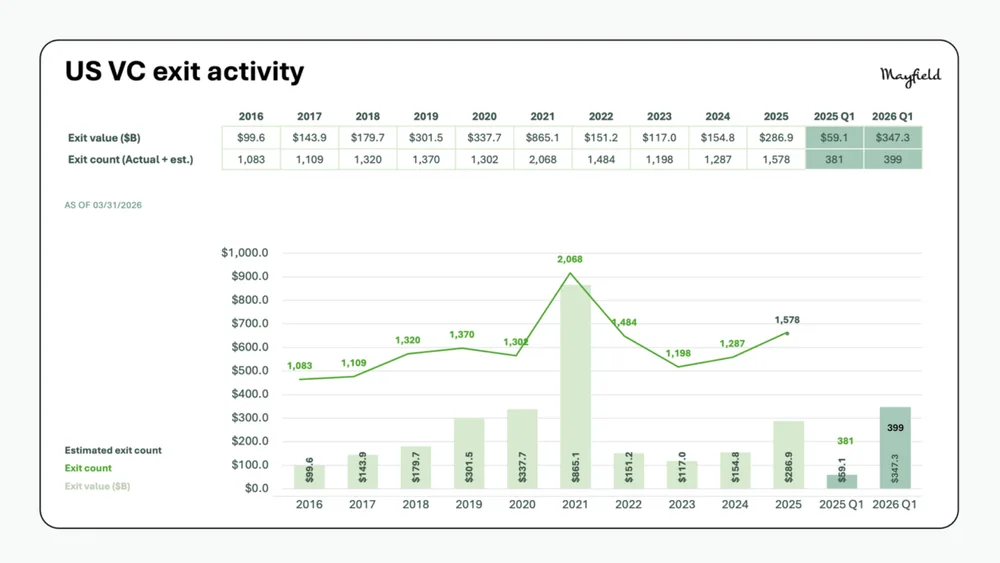
US VC deal activity
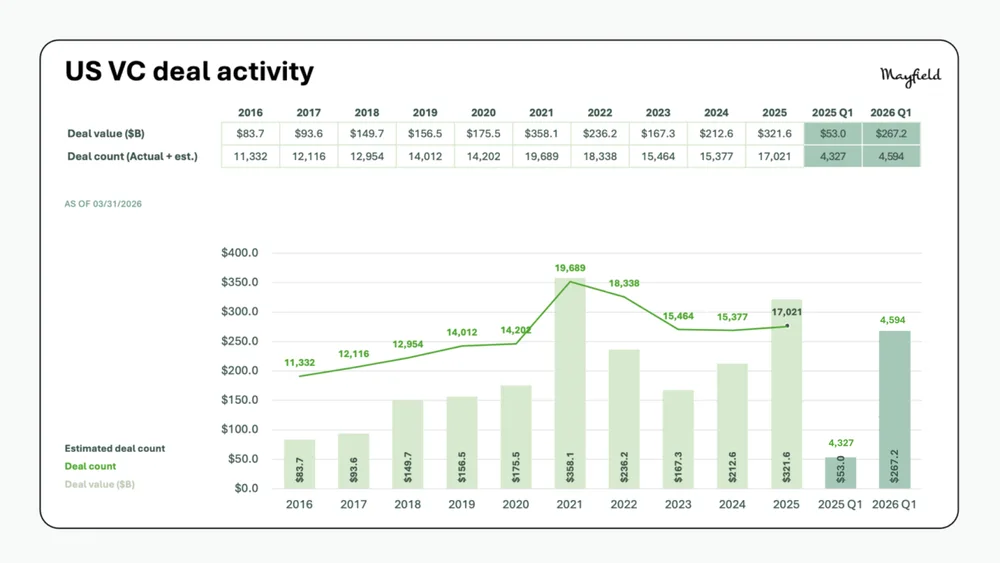
Chart displaying US venture capital deal value and deal count from 2016 through Q1 2026, highlighting a peak in deal value of $358.1B in 2021.
| Label | Value shown on the chart |
|---|---|
| 2016 | $83.7B |
| 2017 | $93.6B |
| 2018 | $149.7B |
| 2019 | $156.5B |
| 2020 | $175.5B |
| 2021 | $358.1B |
| 2022 | $236.2B |
| 2023 | $167.3B |
| 2024 | $212.6B |
| 2025 | $321.6B |
| 2025 Q1 | $53.0B |
| 2026 Q1 | $267.2B |
Shown as a preview with credit and a link to the original. Publishers can request removal.
View the original on mayfield.com