Growth-Adjusted Revenue Multiples
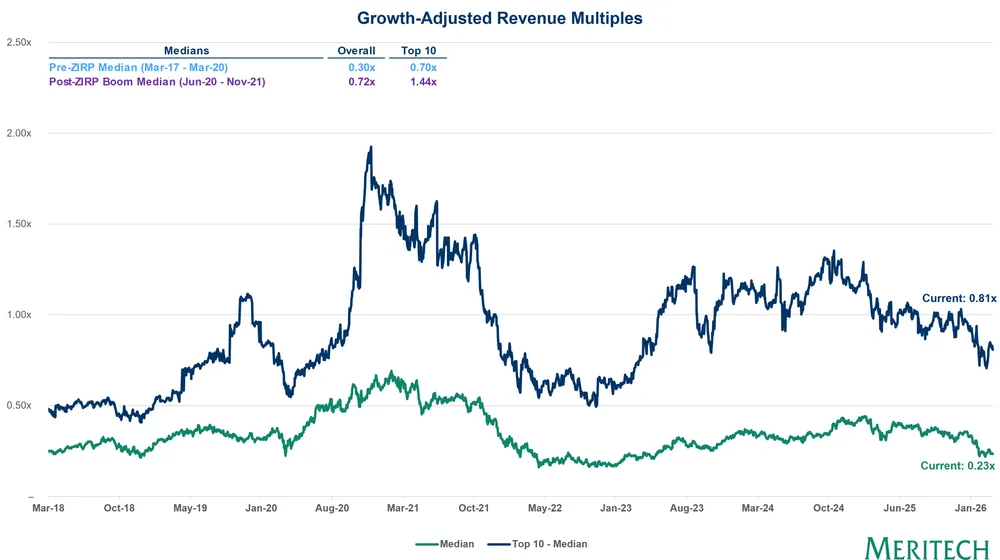
The chart tracks growth-adjusted revenue multiples for software companies from March 2018 through January 2026, comparing overall median multiples against the top 10 median. Current values show the top 10 median at 0.81x and overall median at 0.23x.
| Label | Value shown on the chart |
|---|---|
| Pre-ZIRP Median (Mar-17 - Mar-20) - Overall | 0.30x |
| Pre-ZIRP Median (Mar-17 - Mar-20) - Top 10 | 0.70x |
| Post-ZIRP Boom Median (Jun-20 - Nov-21) - Overall | 0.72x |
| Post-ZIRP Boom Median (Jun-20 - Nov-21) - Top 10 | 1.44x |
| Current (Top 10 - Median) | 0.81x |
| Current (Median) | 0.23x |
Shown as a preview with credit and a link to the original. Publishers can request removal.
View the original on meritech.substack.com