Geography in Online Capital Allocation: Evidence from Equity-Based Crowdfunding (arXiv (Cornell University))
Summary
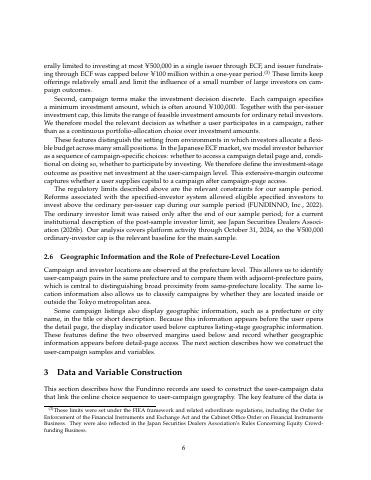
- Regulatory constraints capped ordinary retail investor contributions at ¥500,000 per issuer, while firm fundraising through equity crowdfunding was limited to below ¥100 million per year.p.6
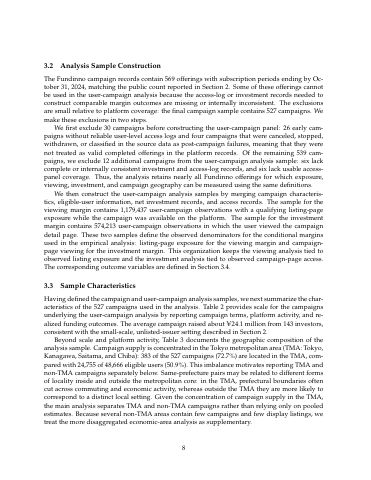
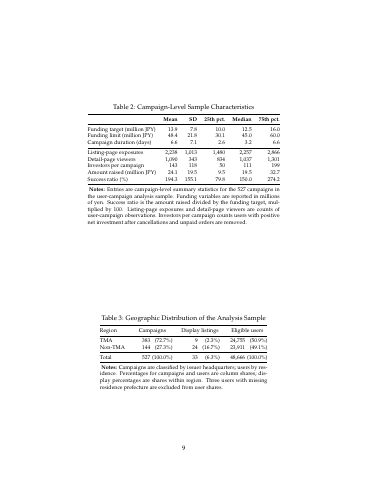
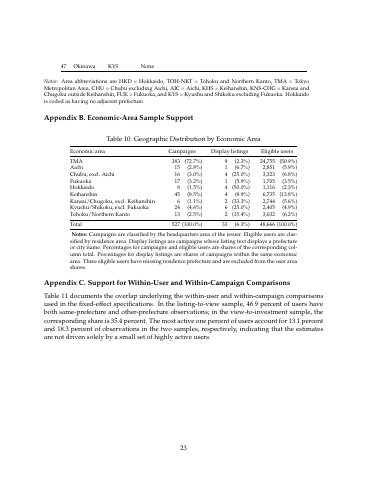
- Campaign supply exhibits strong geographic concentration, with 383 of 527 campaigns (72.7%) originating within the Tokyo metropolitan area.p.8
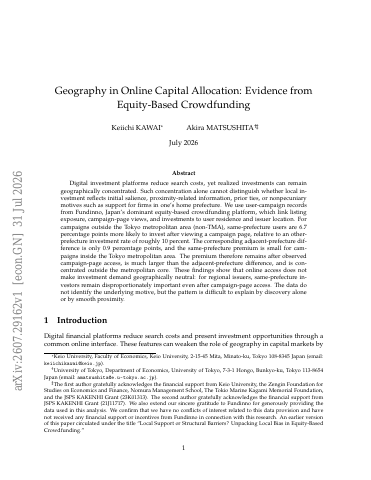
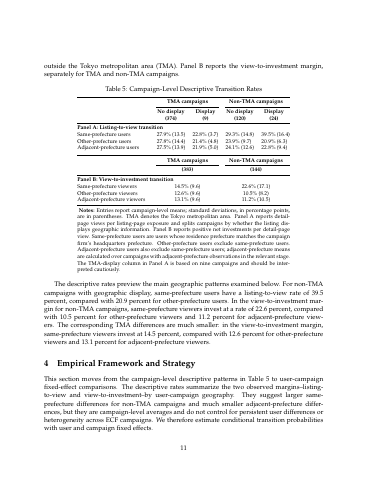
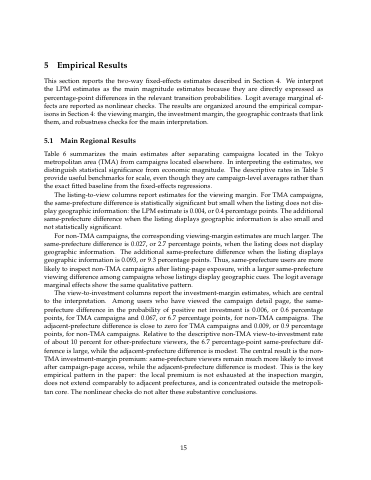
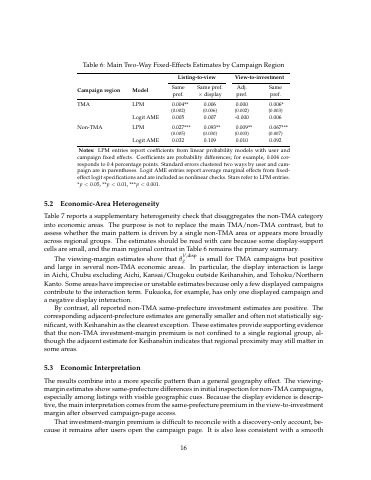
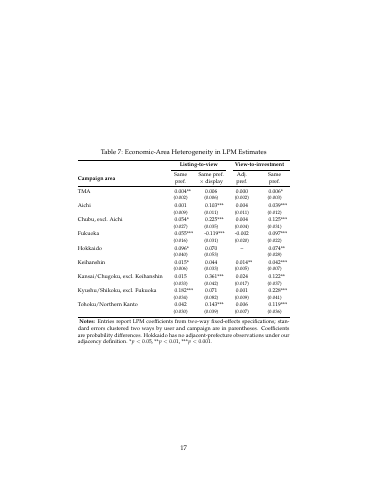
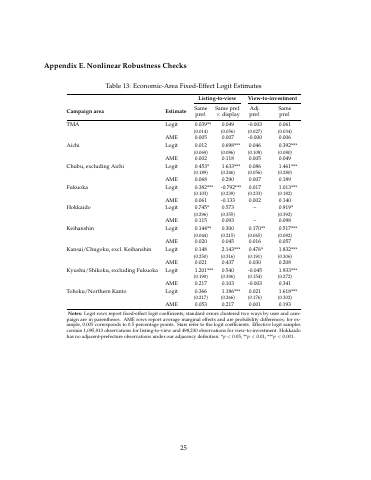
- For campaigns outside the Tokyo metropolitan area, same-prefecture viewers are 6.7 percentage points more likely to invest after inspecting a detail page relative to an other-prefecture investment rate of roughly 10 percent.p.1
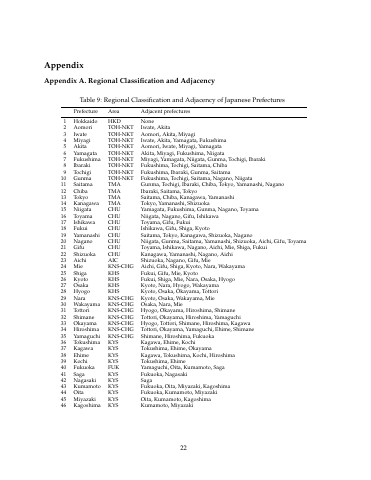
- The corresponding adjacent-prefecture difference for non-metropolitan campaigns is only 0.9 percentage points, demonstrating that local investment demand is tightly bound to home prefectures.p.1
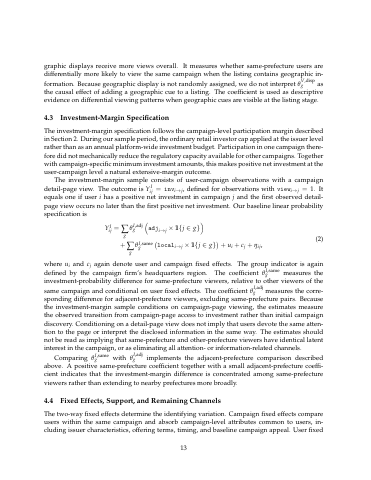
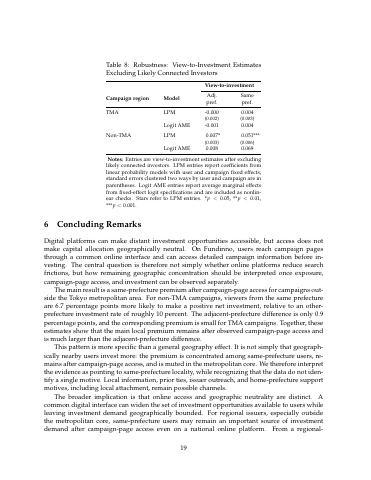
- Excluding likely connected investors reduces the non-metropolitan same-prefecture investment margin estimate from 6.7 to 5.1 percentage points, confirming that direct offline contact does not account for all local demand.p.18
Key insights
- Online investment platforms significantly reduce search costs but do not eliminate geographic concentration in capital allocation.p.1
- Tracking intermediate platform actions like campaign detail-page views makes it possible to separate initial discovery from post-access investment decisions.p.2
- The local investment premium persists even after potential investors access standardized platform disclosures.p.3
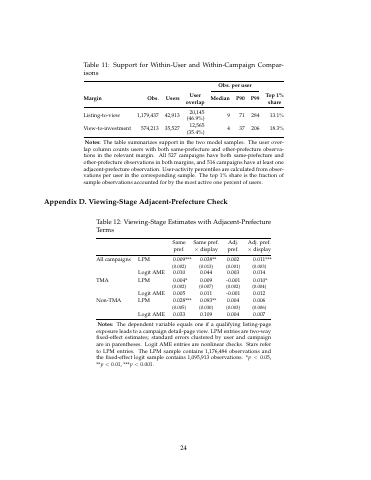
- Home-prefecture investment bias is strongly concentrated outside the core metropolitan region, while the same-prefecture investment premium inside the Tokyo metropolitan area is small at 0.6 percentage points.p.15
- Explicitly displaying geographic names on listing cards increases same-prefecture page-viewing probability by 9.3 percentage points for regional campaigns.p.15
- The stark gap between same-prefecture investment behavior (6.7 percentage points) and adjacent-prefecture behavior (0.9 percentage points) runs counter to smooth geographic proximity models.p.3
- Digital crowdfunding platforms support regional startups primarily by capturing home-prefecture investor demand rather than geographically neutral capital.p.20
Pages
 p.1
 p.2
 p.3
 p.4
 p.5
 p.6
 p.7
 p.8
 p.9
 p.10
 p.11
 p.12
 p.13
 p.14
 p.15
 p.16
 p.17
 p.18
 p.19
 p.20
 p.21
 p.22
 p.23
 p.24
 p.25
Topics and entities
Summary and figures generated from the document and checked automatically: every number shown appears on the cited page. Publishers can request removal.