Public Software Revenue Multiples vs. AI Model Releases
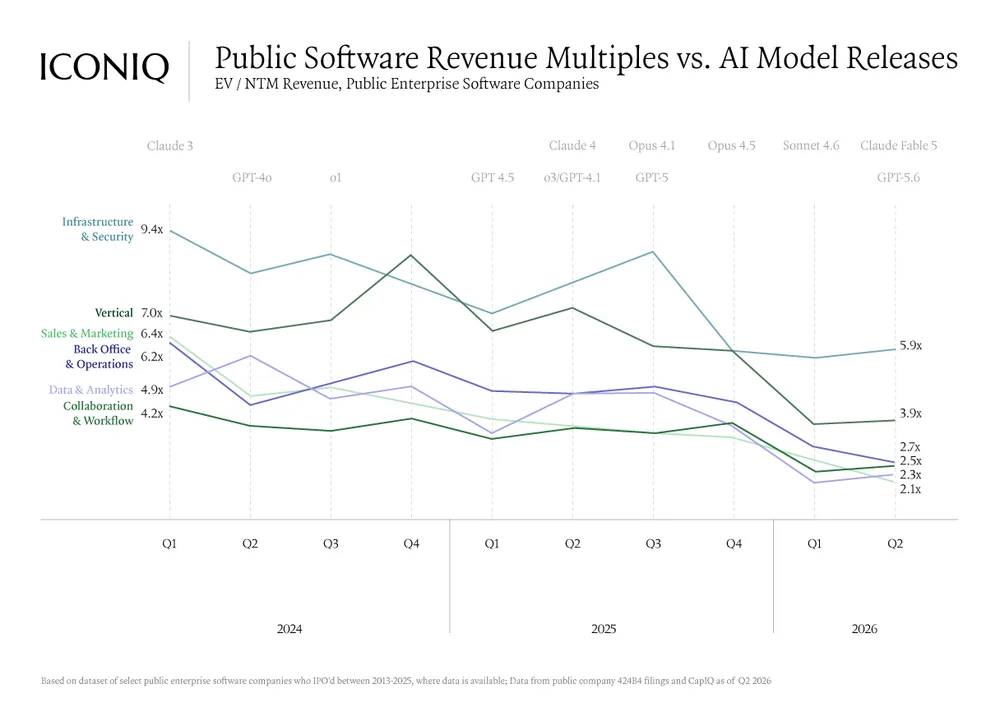
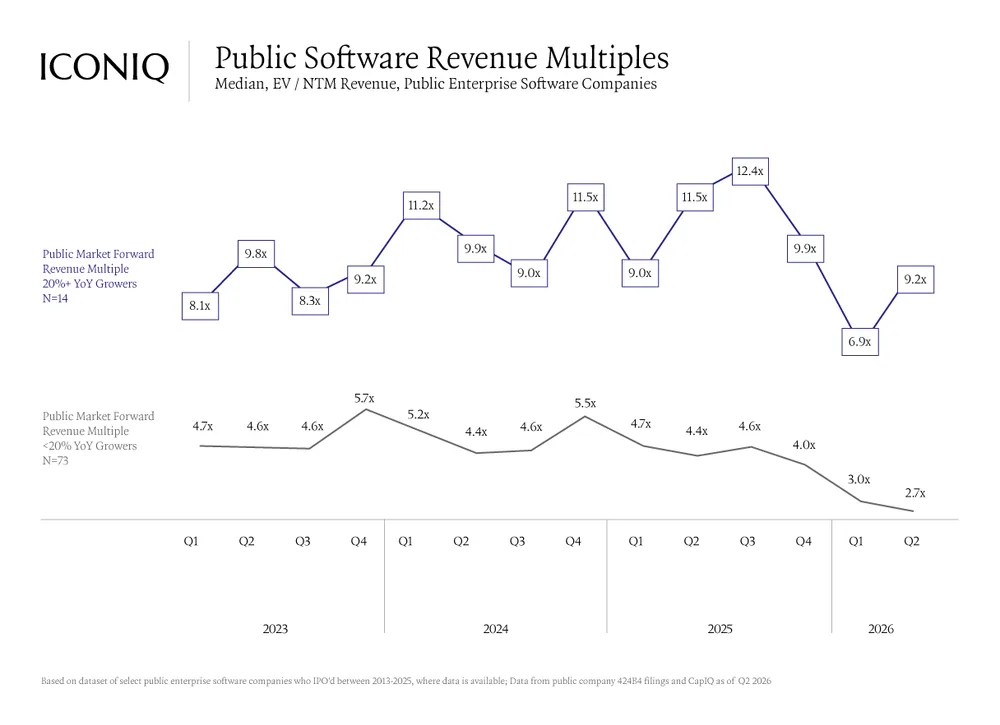
This chart tracks EV / NTM revenue multiples across various public enterprise software sub-sectors alongside major AI model release timelines from Q1 2024 to Q2 2026. Across all sub-sectors, valuation multiples show a general downward trend over the period.
| Label | Value shown on the chart |
|---|---|
| Infrastructure & Security (Q1 2024) | 9.4x |
| Vertical (Q1 2024) | 7.0x |
| Sales & Marketing (Q1 2024) | 6.4x |
| Back Office & Operations (Q1 2024) | 6.2x |
| Data & Analytics (Q1 2024) | 4.9x |
| Collaboration & Workflow (Q1 2024) | 4.2x |
| Infrastructure & Security (Q2 2026) | 5.9x |
| Vertical (Q2 2026) | 3.9x |
| Back Office & Operations (Q2 2026) | 2.7x |
| Collaboration & Workflow (Q2 2026) | 2.5x |
| Sales & Marketing (Q2 2026) | 2.3x |
| Data & Analytics (Q2 2026) | 2.1x |
Shown as a preview with credit and a link to the original. Publishers can request removal.
View the original on iconiq.com