Public Software Revenue Multiples
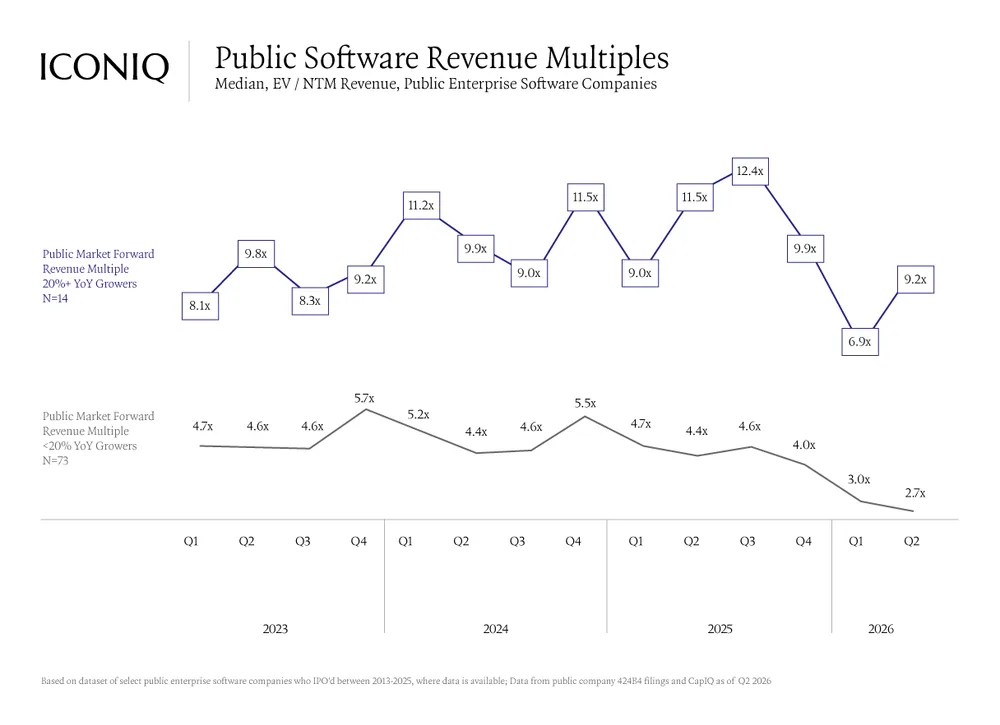
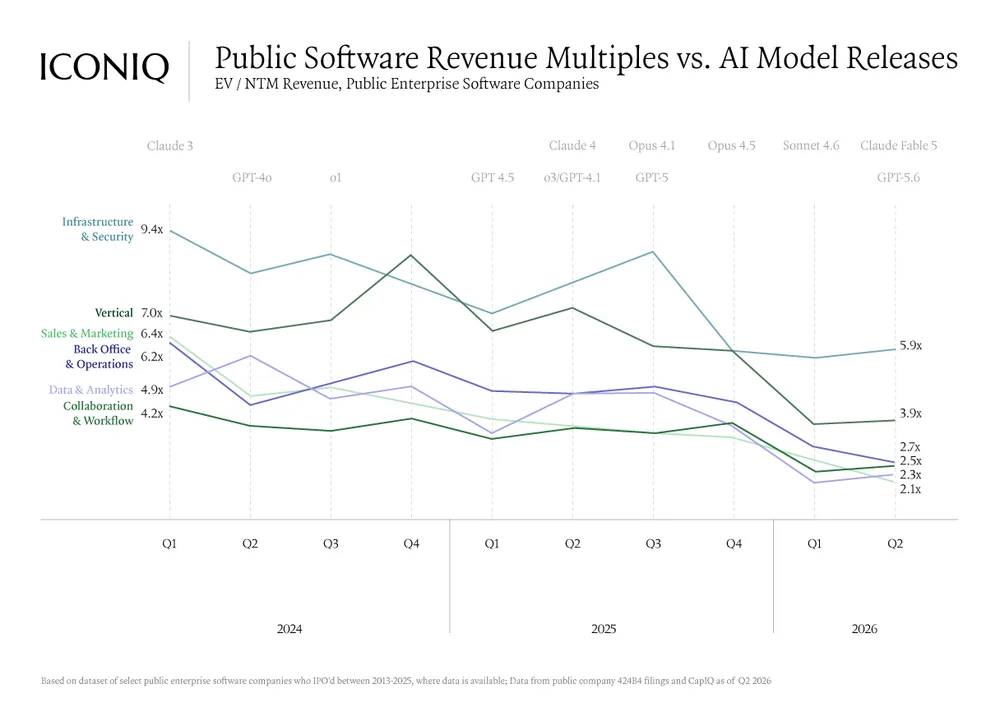
This chart tracks median EV/NTM revenue multiples for public enterprise software companies, contrasting high-growth (20%+ YoY) with lower-growth (<20% YoY) businesses from Q1 2023 through Q2 2026. High-growth software companies maintain significantly higher revenue multiples across all quarters.
| Label | Value shown on the chart |
|---|---|
| 20%+ YoY Growers (Q1 2023) | 8.1x |
| <20% YoY Growers (Q1 2023) | 4.7x |
| 20%+ YoY Growers (Q1 2024) | 11.2x |
| <20% YoY Growers (Q1 2024) | 5.2x |
| 20%+ YoY Growers (Q3 2025) | 12.4x |
| <20% YoY Growers (Q3 2025) | 4.6x |
| 20%+ YoY Growers (Q1 2026) | 6.9x |
| <20% YoY Growers (Q1 2026) | 3.0x |
| 20%+ YoY Growers (Q2 2026) | 9.2x |
| <20% YoY Growers (Q2 2026) | 2.7x |
Shown as a preview with credit and a link to the original. Publishers can request removal.
View the original on iconiq.com