Burn Multiple (FCF / Net New ARR)
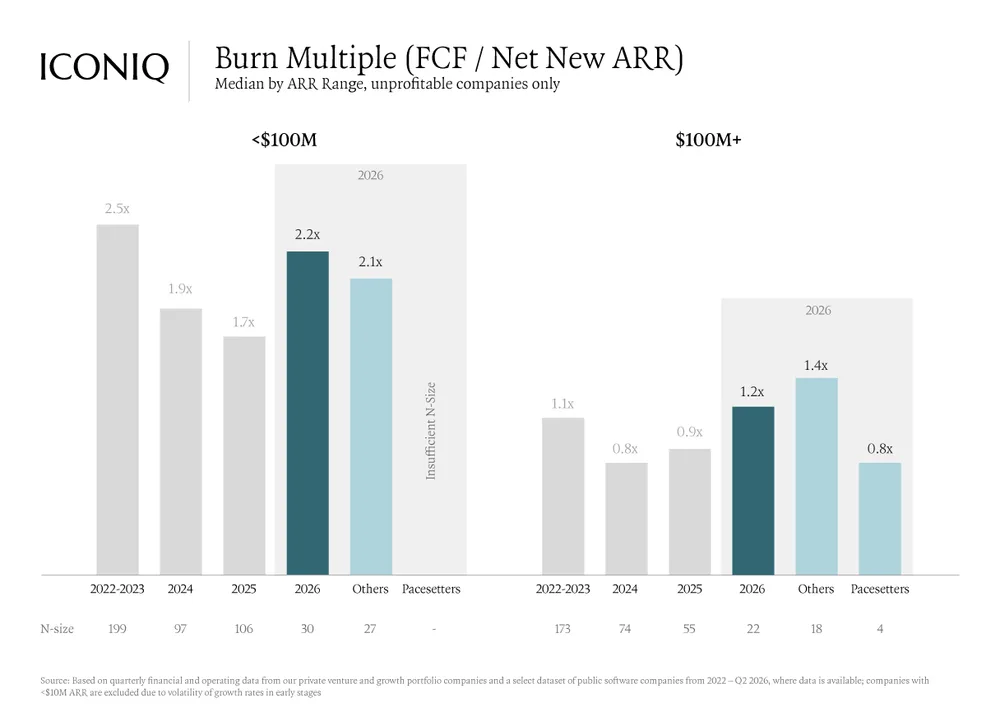
Median Burn Multiple by ARR range for unprofitable software companies from 2022 to 2026. Companies with $100M+ ARR show lower burn multiples across all years compared to those under $100M ARR.
| Label | Value shown on the chart |
|---|---|
| <$100M (2022-2023) | 2.5x |
| <$100M (2024) | 1.9x |
| <$100M (2025) | 1.7x |
| <$100M (2026) | 2.2x |
| <$100M (2026 Others) | 2.1x |
| $100M+ (2022-2023) | 1.1x |
| $100M+ (2024) | 0.8x |
| $100M+ (2025) | 0.9x |
| $100M+ (2026) | 1.2x |
| $100M+ (2026 Others) | 1.4x |
| $100M+ (2026 Pacesetters) | 0.8x |
Shown as a preview with credit and a link to the original. Publishers can request removal.
View the original on iconiq.com