Headcount Change % vs. ARR or Revenue Growth
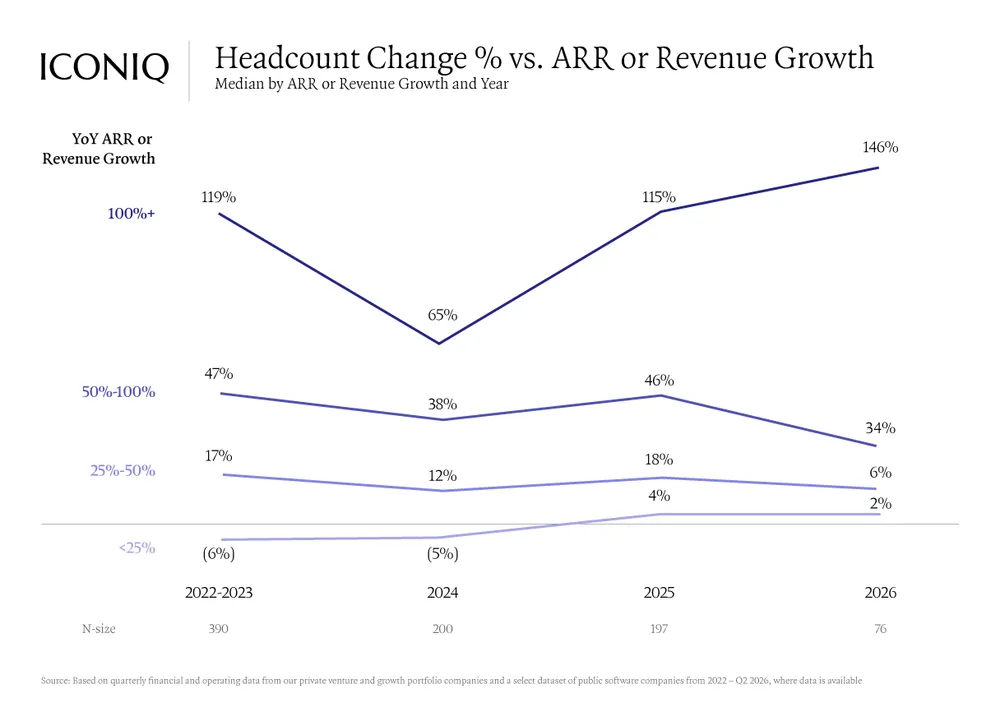
Chart showing median headcount change percentage across different YoY ARR or revenue growth bands from 2022-2023 to 2026. Higher growth startups (100%+) significantly increased headcount growth rates by 2026 compared to slower-growing peers.
| Label | Value shown on the chart |
|---|---|
| 100%+ Growth (2022-2023) | 119% |
| 100%+ Growth (2024) | 65% |
| 100%+ Growth (2025) | 115% |
| 100%+ Growth (2026) | 146% |
| 50%-100% Growth (2022-2023) | 47% |
| 50%-100% Growth (2026) | 34% |
| 25%-50% Growth (2022-2023) | 17% |
| 25%-50% Growth (2026) | 6% |
| <25% Growth (2022-2023) | (6%) |
| <25% Growth (2026) | 2% |
Shown as a preview with credit and a link to the original. Publishers can request removal.
View the original on iconiq.com