Net Dollar Retention: Median and Top Quartile by ARR Range
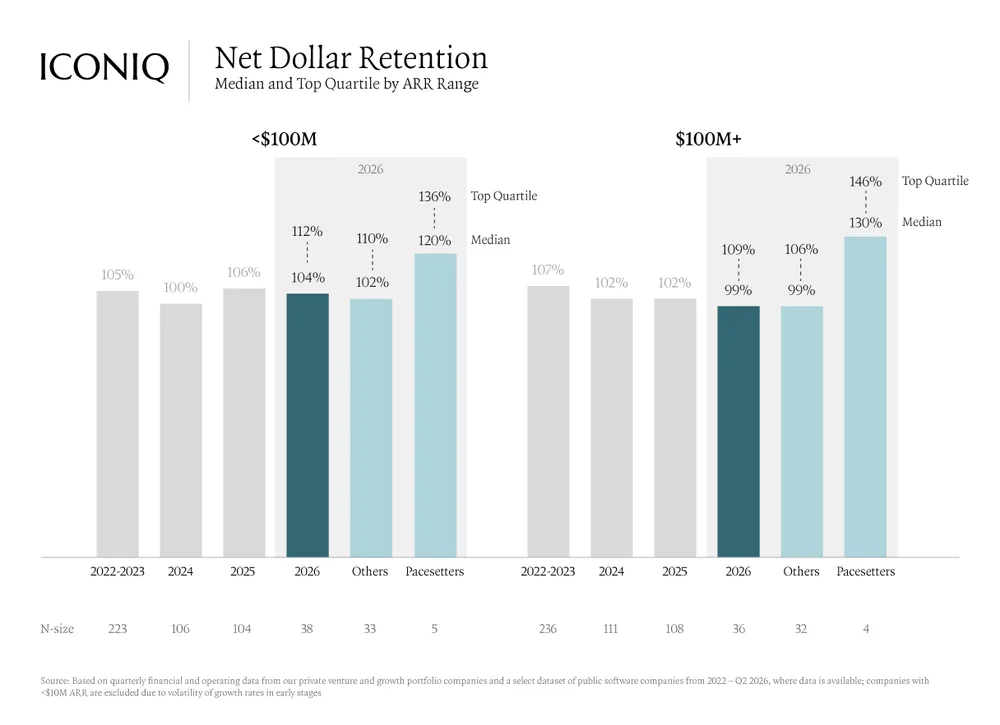
The chart illustrates net dollar retention (NDR) trends across software companies categorized by ARR range (<$100M vs $100M+) from 2022 through 2026. Top quartile performers and Pacesetters significantly outperform others in both ARR categories.
| Label | Value shown on the chart |
|---|---|
| <$100M 2022-2023 Median | 105% |
| <$100M 2024 Median | 100% |
| <$100M 2025 Median | 106% |
| <$100M 2026 Median | 104% |
| <$100M 2026 Top Quartile | 112% |
| <$100M 2026 Pacesetters Median | 120% |
| <$100M 2026 Pacesetters Top Quartile | 136% |
| $100M+ 2022-2023 Median | 107% |
| $100M+ 2024 Median | 102% |
| $100M+ 2025 Median | 102% |
| $100M+ 2026 Median | 99% |
| $100M+ 2026 Pacesetters Median | 130% |
Shown as a preview with credit and a link to the original. Publishers can request removal.
View the original on iconiq.com