Gross New ARR or Revenue Distribution
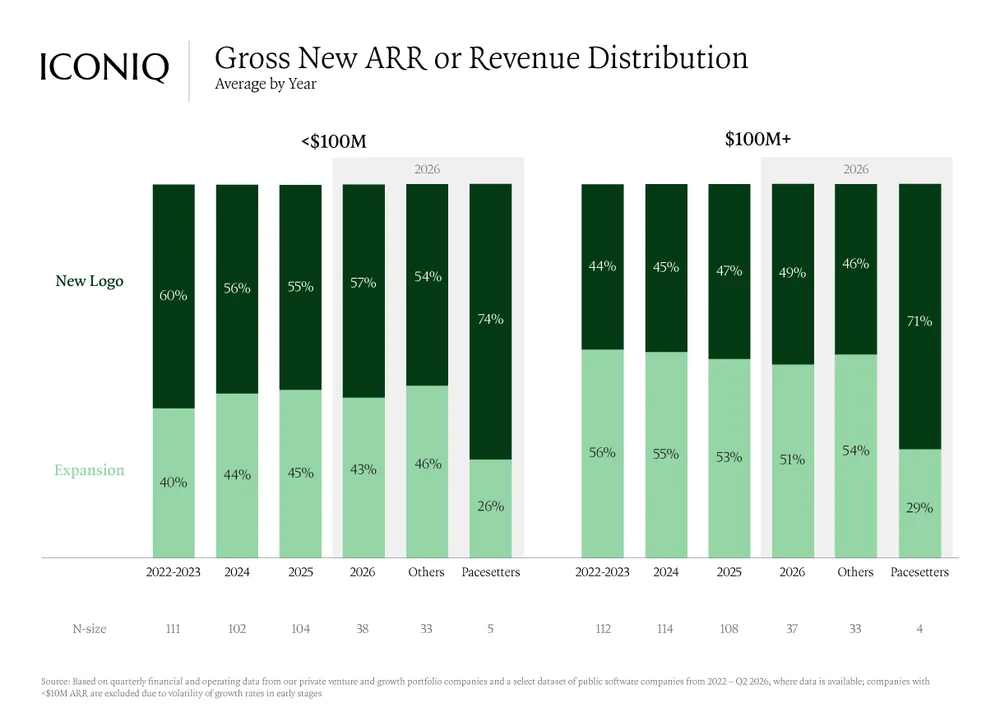
The chart shows the distribution of gross new ARR between New Logo and Expansion across companies under $100M and over $100M ARR from 2022 to 2026. Pacesetters derive a much higher percentage of gross new ARR from New Logo compared to other companies.
| Label | Value shown on the chart |
|---|---|
| <$100M Pacesetters New Logo | 74% |
| <$100M Pacesetters Expansion | 26% |
| <$100M Others New Logo | 54% |
| <$100M Others Expansion | 46% |
| $100M+ Pacesetters New Logo | 71% |
| $100M+ Pacesetters Expansion | 29% |
| $100M+ Others New Logo | 46% |
| $100M+ Others Expansion | 54% |
| <$100M 2026 New Logo | 57% |
| <$100M 2026 Expansion | 43% |
| $100M+ 2026 New Logo | 49% |
| $100M+ 2026 Expansion | 51% |
Shown as a preview with credit and a link to the original. Publishers can request removal.
View the original on iconiq.com