Founder performance by age group
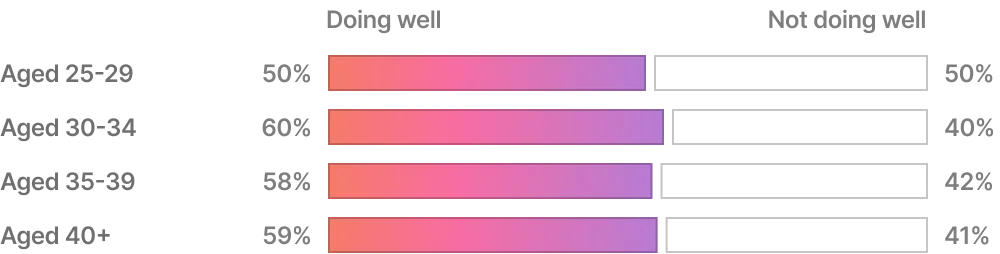
A horizontal bar chart showing the percentage of startup founders doing well versus not doing well across various age brackets. Founders aged 30-34 show the highest rate of doing well at 60%.
| Label | Value shown on the chart |
|---|---|
| Aged 25-29 - Doing well | 50% |
| Aged 25-29 - Not doing well | 50% |
| Aged 30-34 - Doing well | 60% |
| Aged 30-34 - Not doing well | 40% |
| Aged 35-39 - Doing well | 58% |
| Aged 35-39 - Not doing well | 42% |
| Aged 40+ - Doing well | 59% |
| Aged 40+ - Not doing well | 41% |
Shown as a preview with credit and a link to the original. Publishers can request removal.