Where a data center's power actually goes
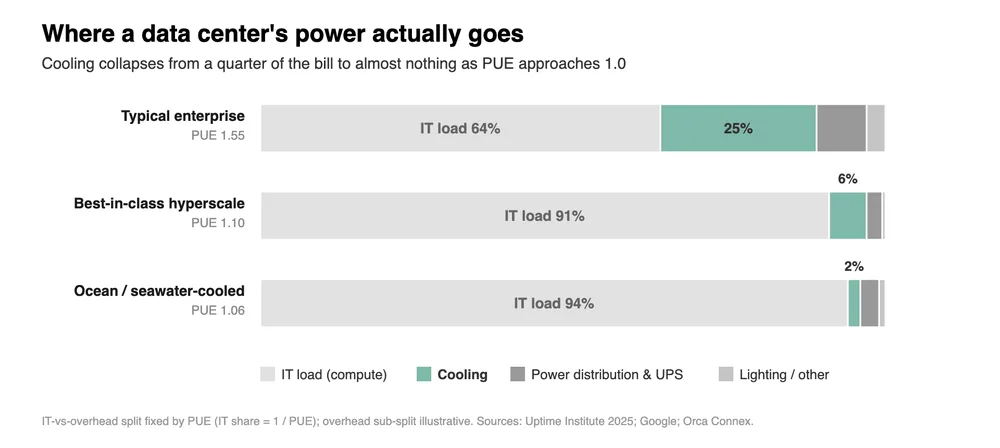
The chart shows how power consumption is allocated in data centers across different efficiency levels (PUE), with cooling dropping from 25% in a typical enterprise setup to just 2% in ocean or seawater-cooled facilities.
| Label | Value shown on the chart |
|---|---|
| Typical enterprise - IT load | 64% |
| Typical enterprise - Cooling | 25% |
| Best-in-class hyperscale - IT load | 91% |
| Best-in-class hyperscale - Cooling | 6% |
| Ocean / seawater-cooled - IT load | 94% |
| Ocean / seawater-cooled - Cooling | 2% |
Shown as a preview with credit and a link to the original. Publishers can request removal.
View the original on konvoy.vc