Revenue growth rate vs Stock price (indexed)
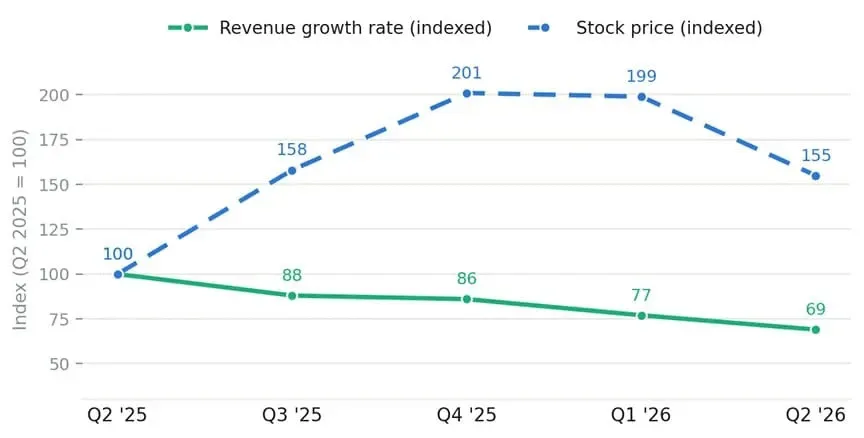
The chart tracks AppLovin's indexed revenue growth rate and stock price from Q2 '25 to Q2 '26 (indexed to Q2 2025 = 100). While stock price peaked at 201 in Q4 '25 before dropping to 155 in Q2 '26, revenue growth rate continuously declined from 100 to 69.
| Label | Value shown on the chart |
|---|---|
| Q2 '25 Revenue growth rate | 100 |
| Q3 '25 Revenue growth rate | 88 |
| Q4 '25 Revenue growth rate | 86 |
| Q1 '26 Revenue growth rate | 77 |
| Q2 '26 Revenue growth rate | 69 |
| Q2 '25 Stock price | 100 |
| Q3 '25 Stock price | 158 |
| Q4 '25 Stock price | 201 |
| Q1 '26 Stock price | 199 |
| Q2 '26 Stock price | 155 |
Shown as a preview with credit and a link to the original. Publishers can request removal.
View the original on konvoy.vc