Roblox share price since listing
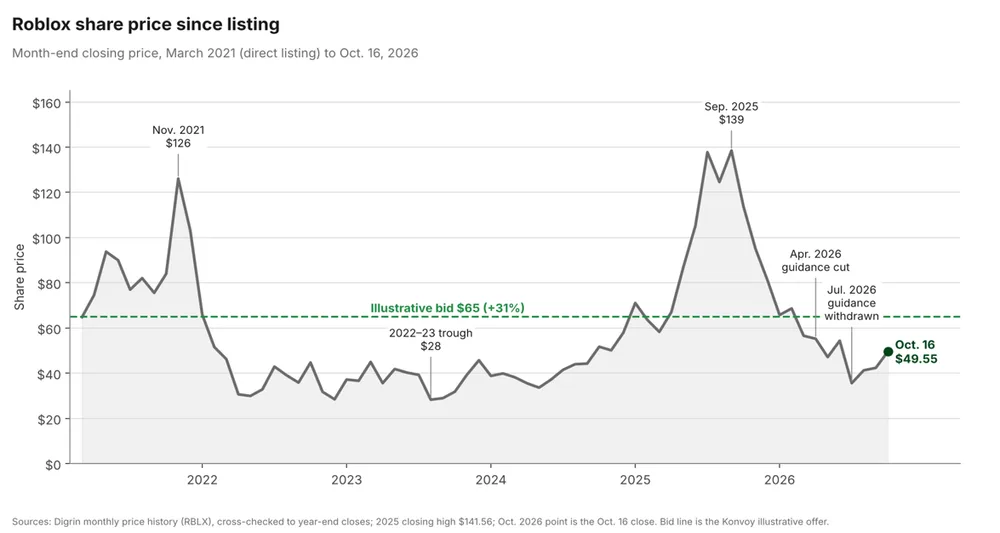
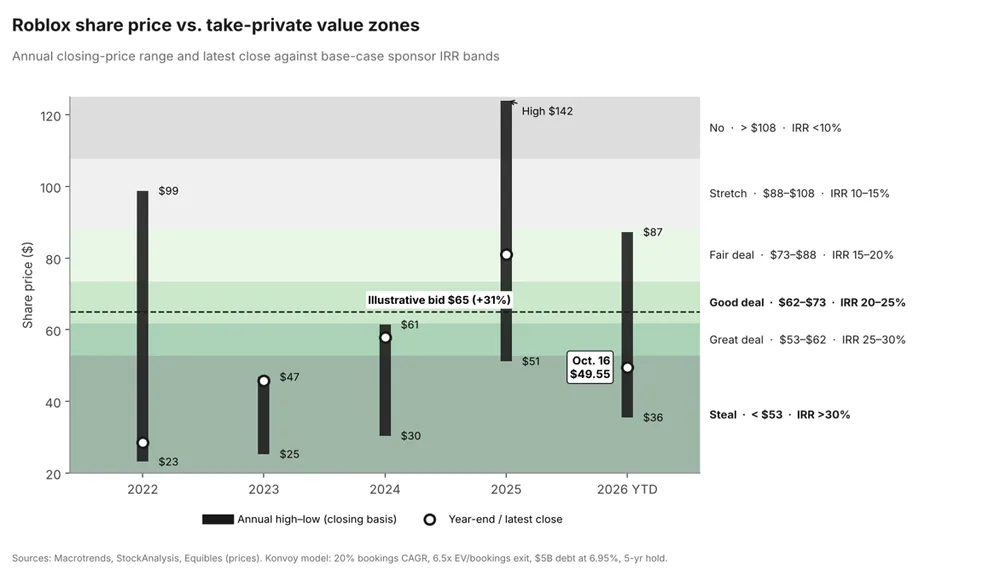
This line chart tracks Roblox's month-end closing share price from March 2021 to October 2026, detailing historical peaks, troughs, and guidance cuts against an illustrative private equity bid.
| Label | Value shown on the chart |
|---|---|
| Nov. 2021 | $126 |
| 2022-23 trough | $28 |
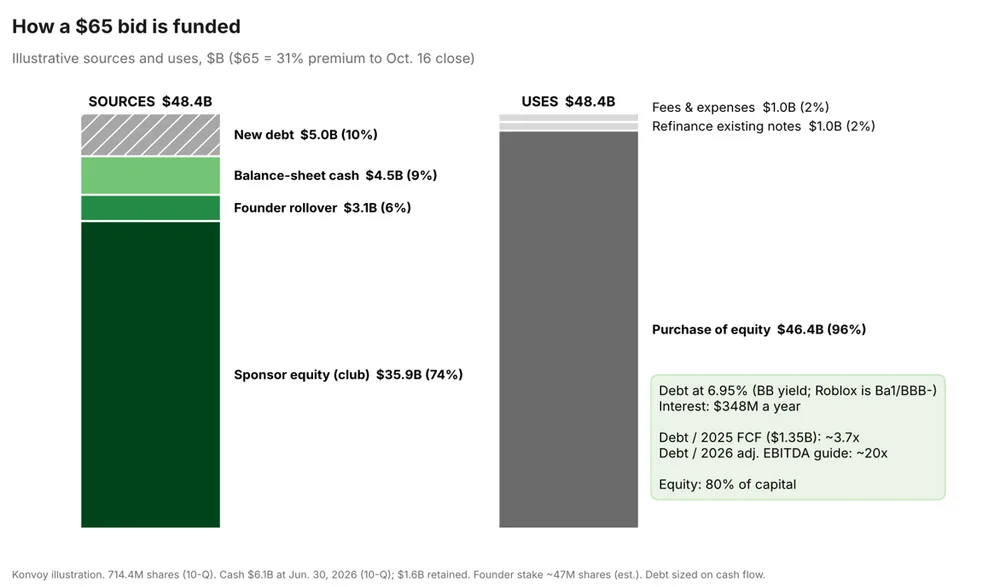
| Illustrative bid | $65 |
| Sep. 2025 | $139 |
| Oct. 16 | $49.55 |
Shown as a preview with credit and a link to the original. Publishers can request removal.
View the original on konvoy.vc