Global nuclear energy capacity and number of reactors
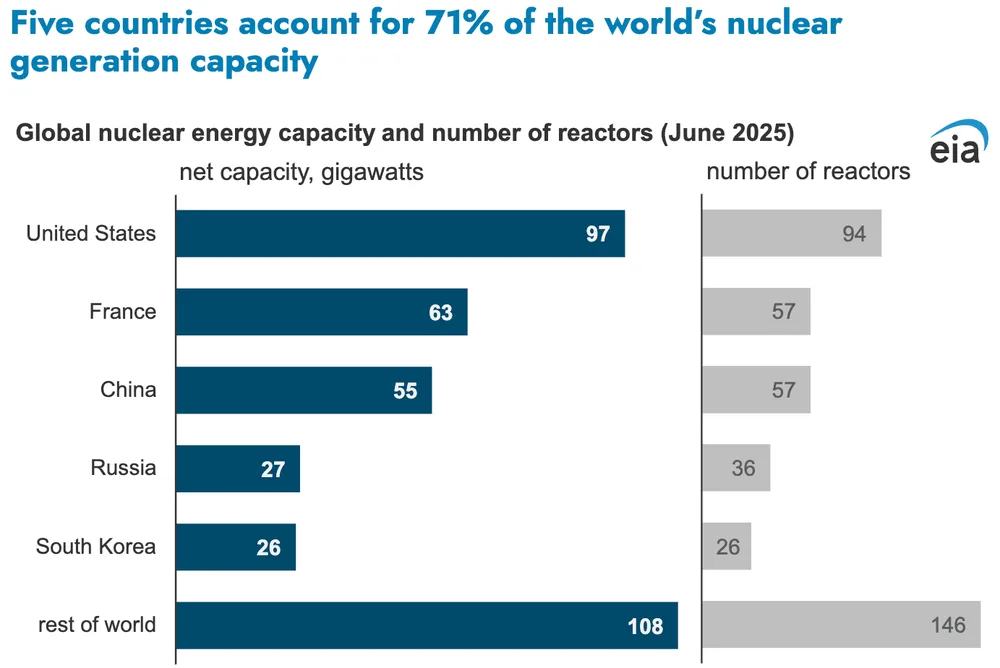
Horizontal bar chart showing the global nuclear energy capacity in gigawatts and the number of reactors by country as of June 2025. The United States leads with 97 GW across 94 reactors, followed by France and China.
| Label | Value shown on the chart |
|---|---|
| United States - net capacity (GW) | 97 |
| United States - reactors | 94 |
| France - net capacity (GW) | 63 |
| France - reactors | 57 |
| China - net capacity (GW) | 55 |
| China - reactors | 57 |
| Russia - net capacity (GW) | 27 |
| Russia - reactors | 36 |
| South Korea - net capacity (GW) | 26 |
| South Korea - reactors | 26 |
| rest of world - net capacity (GW) | 108 |
| rest of world - reactors | 146 |
Shown as a preview with credit and a link to the original. Publishers can request removal.
View the original on konvoy.vc