iOS Apps Released Each Month - Y/Y %
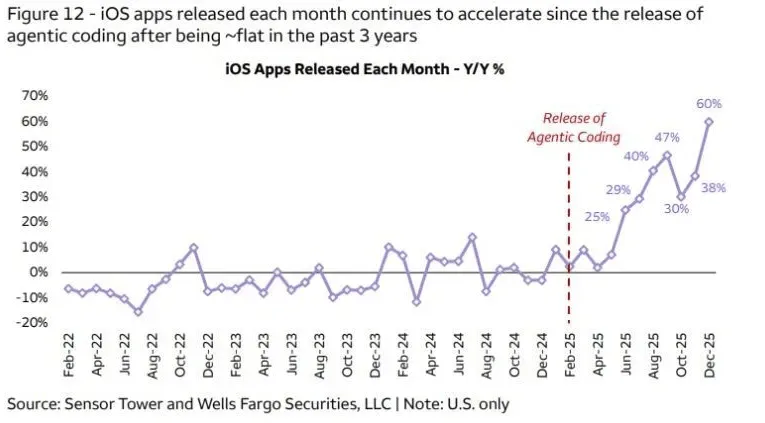
Line chart measuring the year-over-year percentage change in monthly iOS app releases in the U.S. between February 2022 and December 2025. It illustrates a flat growth trend before early 2025, followed by a sharp acceleration up to 60% growth in December 2025 after the release of agentic coding.
| Label | Value shown on the chart |
|---|---|
| May-25 | 25% |
| Jun-25 | 29% |
| Jul-25 | 40% |
| Aug-25 | 47% |
| Oct-25 | 30% |
| Nov-25 | 38% |
| Dec-25 | 60% |
Shown as a preview with credit and a link to the original. Publishers can request removal.
View the original on konvoy.vc