Electricity consumption, server stock and server capacity
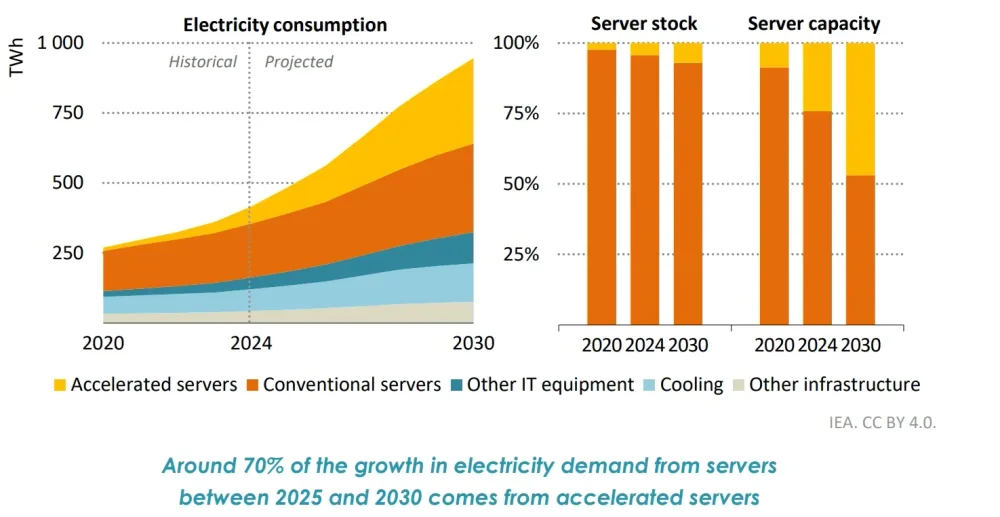
Charts displaying historical and projected electricity consumption (in TWh) from 2020 to 2030 along with the breakdown of server stock and server capacity. Around 70% of the growth in electricity demand from servers between 2025 and 2030 comes from accelerated servers.
| Label | Value shown on the chart |
|---|---|
| Growth in electricity demand from servers between 2025 and 2030 from accelerated | 70% |
Shown as a preview with credit and a link to the original. Publishers can request removal.
View the original on konvoy.vc