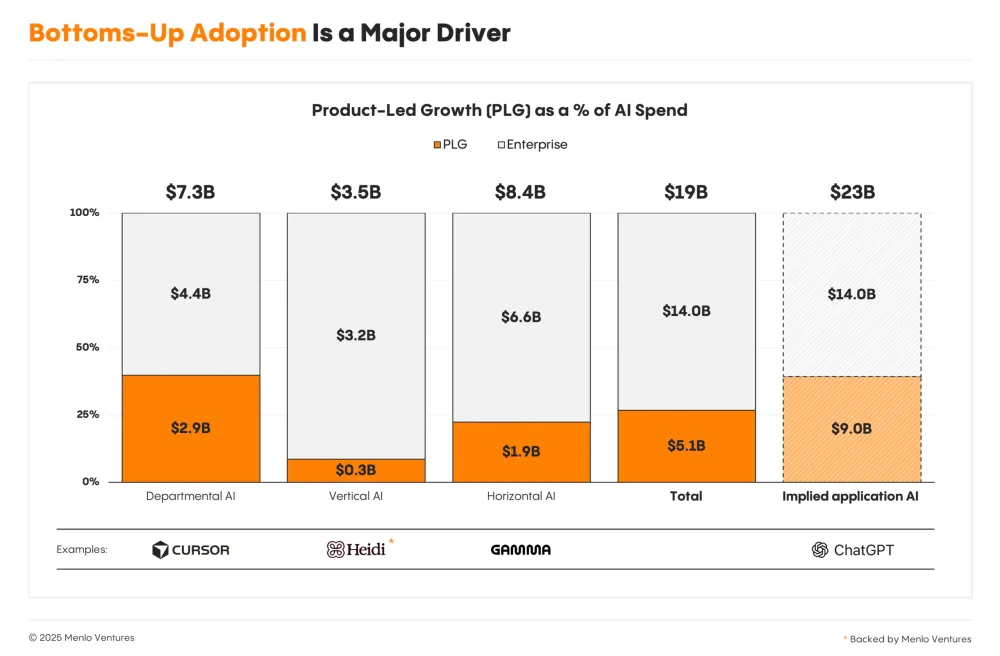
Departmental AI Spend by Category
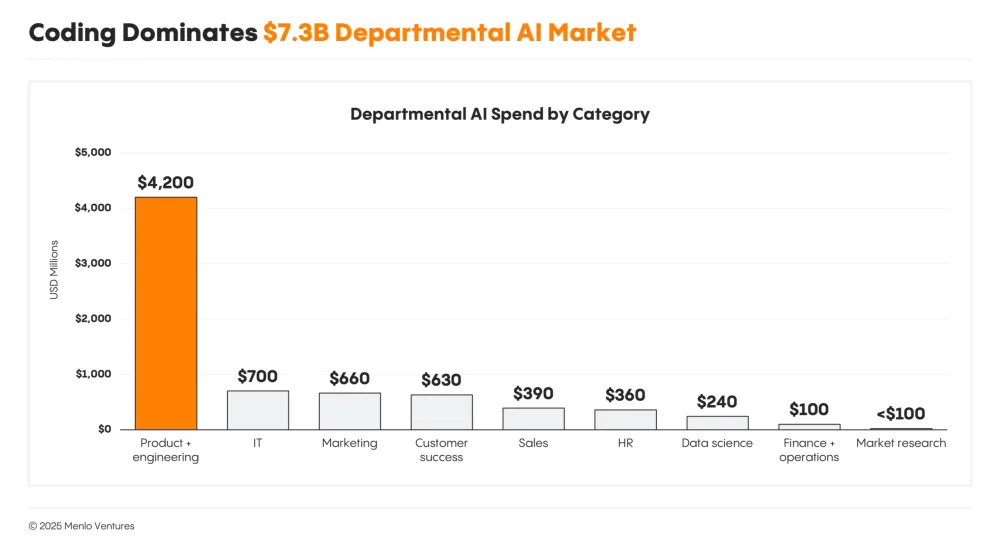
Bar chart illustrating enterprise departmental AI spending by category, showing that Product + engineering overwhelmingly leads with $4,200 million out of the total $7.3 billion market.
| Label | Value shown on the chart |
|---|---|
| Product + engineering | $4,200 |
| IT | $700 |
| Marketing | $660 |
| Customer success | $630 |
| Sales | $390 |
| HR | $360 |
| Data science | $240 |
| Finance + operations | $100 |
| Market research | <$100 |
Shown as a preview with credit and a link to the original. Publishers can request removal.
View the original on menlovc.com