Product-Led Growth (PLG) as a % of AI Spend
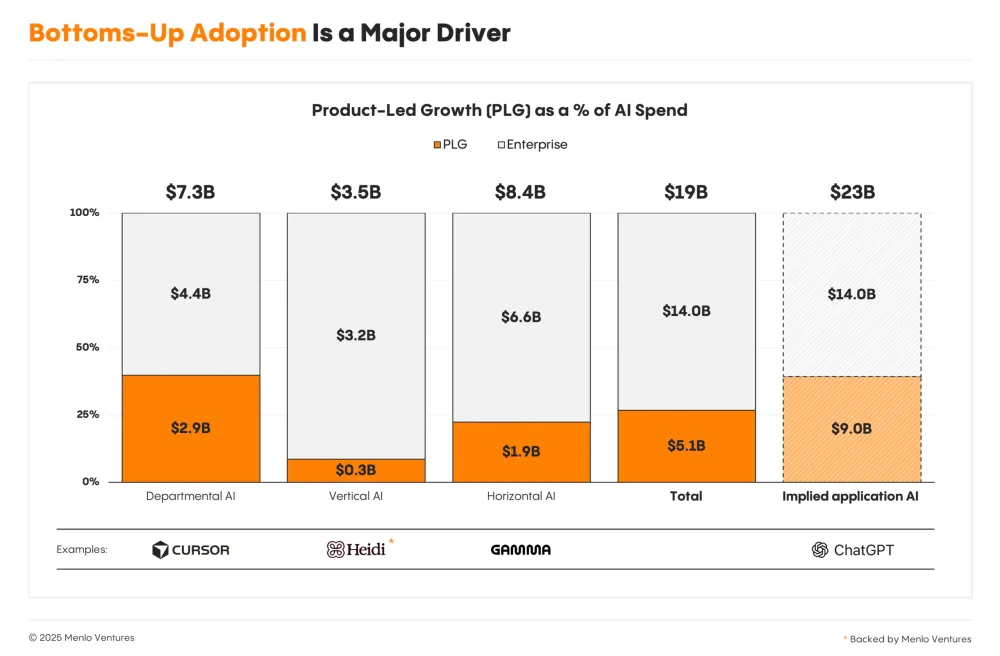
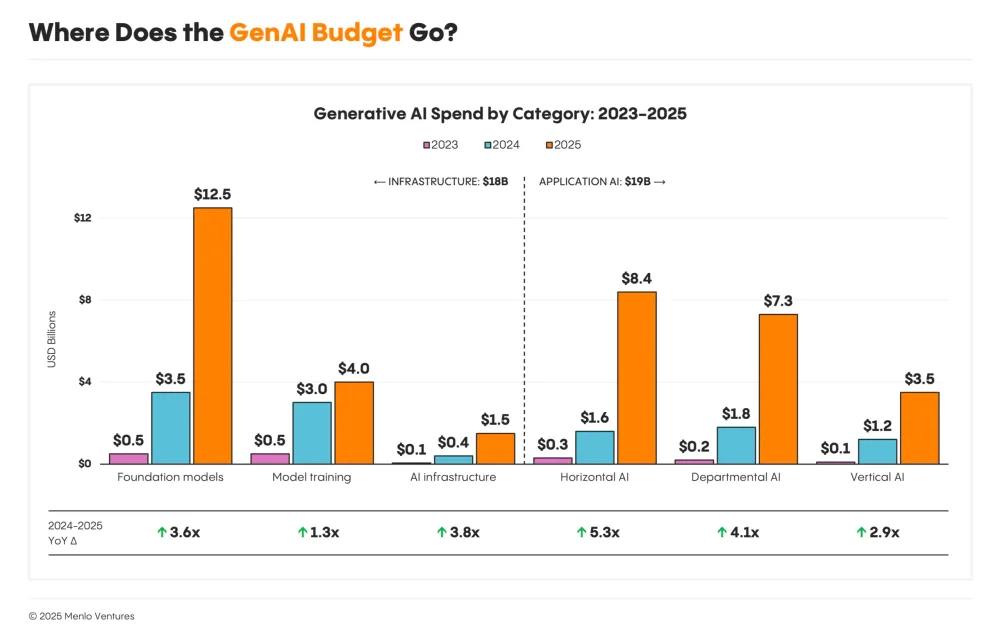
The chart shows the breakdown of AI spend between Product-Led Growth (PLG) and Enterprise across various AI software categories. Overall, PLG accounts for $5.1B of the $19B total AI spend across Departmental, Vertical, and Horizontal AI categories.
| Label | Value shown on the chart |
|---|---|
| Departmental AI - PLG | $2.9B |
| Departmental AI - Enterprise | $4.4B |
| Vertical AI - PLG | $0.3B |
| Vertical AI - Enterprise | $3.2B |
| Horizontal AI - PLG | $1.9B |
| Horizontal AI - Enterprise | $6.6B |
| Total - PLG | $5.1B |
| Total - Enterprise | $14.0B |
| Implied application AI - PLG | $9.0B |
| Implied application AI - Enterprise | $14.0B |
Shown as a preview with credit and a link to the original. Publishers can request removal.
View the original on menlovc.com