DEC 2027 WTI
Save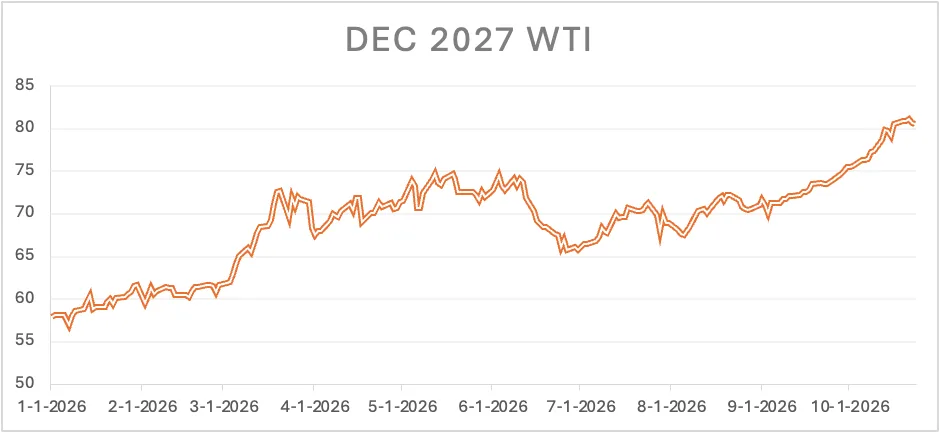
The chart shows the price movement of December 2027 WTI crude oil futures from January 2026 to October 2026. Prices trended upwards over the period, rising from around 58 to over 80.
Shown as a preview with credit and a link to the original. Publishers can request removal.
View the original on sagard.com