Current WTI Price
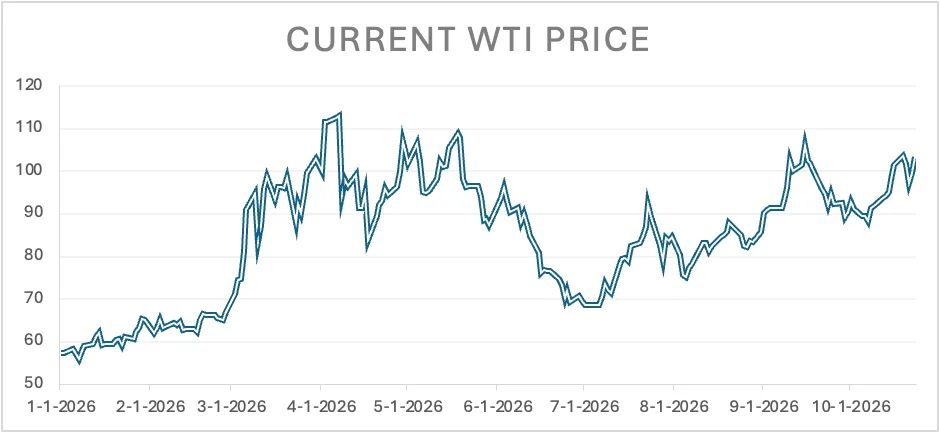
A line chart showing front-month WTI crude oil price movements from January 2026 to October 2026.
Shown as a preview with credit and a link to the original. Publishers can request removal.
View the original on sagard.com
A line chart showing front-month WTI crude oil price movements from January 2026 to October 2026.
Shown as a preview with credit and a link to the original. Publishers can request removal.
View the original on sagard.com