10-Year US Treasury Yield, 2001–2026
Save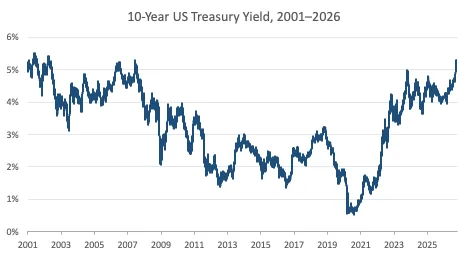
A line chart tracking the 10-Year US Treasury Yield from 2001 to 2026, showing significant fluctuations ranging from below 1% in 2020 to over 5% in the early 2000s and mid-2020s.
Shown as a preview with credit and a link to the original. Publishers can request removal.
View the original on sagard.com