A line you don't want to cross
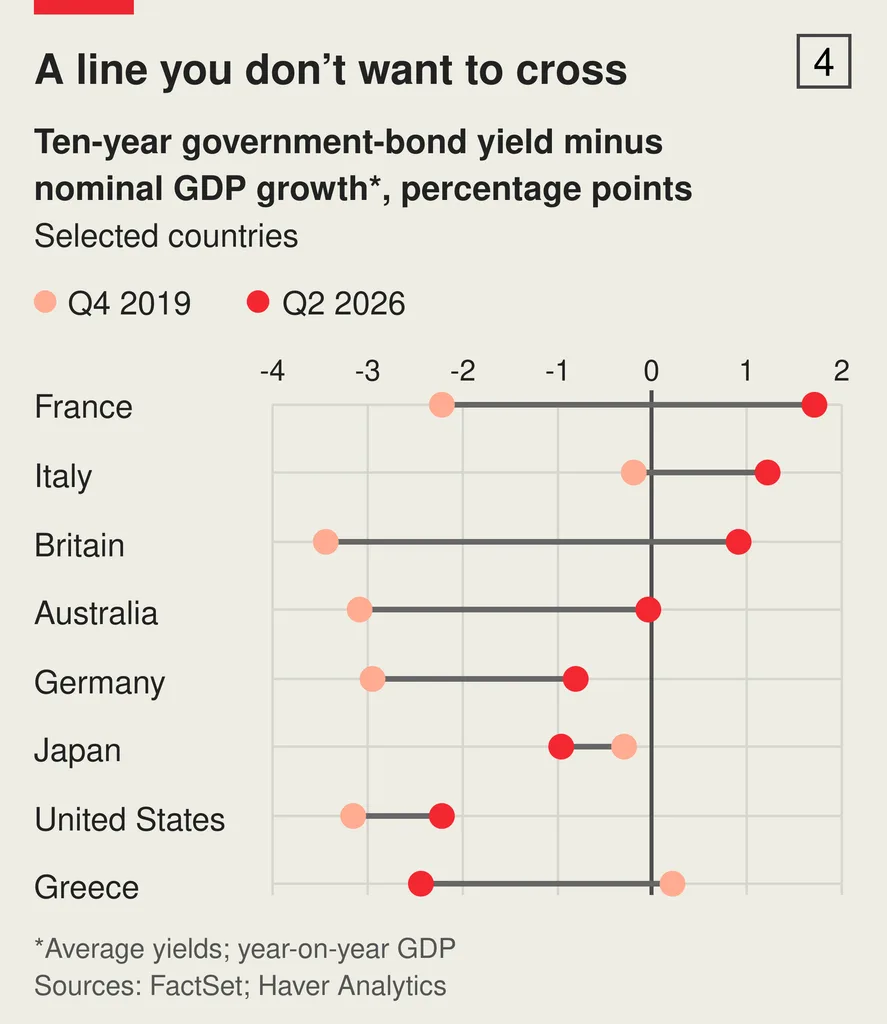
The chart illustrates the difference between ten-year government-bond yields and nominal GDP growth rate in percentage points across selected major economies, comparing Q4 2019 with Q2 2026 projections.
Shown as a preview with credit and a link to the original. Publishers can request removal.
View the original on sagard.com