Financial Signals and Firm Value in Indonesia’s SME Acceleration Board: Evidence from Sales Growth, Profitability, and Firm Size (JPI Jurnal Pustaka Indonesia)
SaveSummary
- The study analyzed a balanced panel of 13 SME issuers listed on the Indonesia Stock Exchange Acceleration Board across 39 firm-year observations from 2022 to 2024.p.1
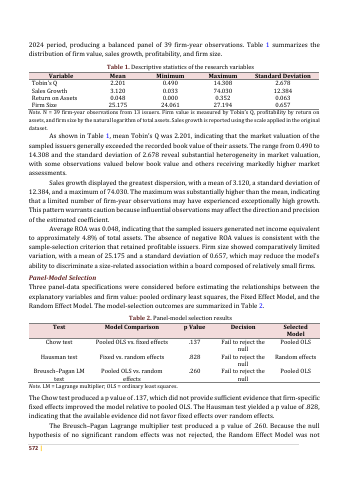
- Sample issuers recorded a mean Tobin’s Q of 2.201, with individual values ranging from 0.490 to 14.308.p.7
- Average sales growth across the sampled observations was 3.120, with a maximum value of 74.030.p.7
- Firm size, calculated as the natural logarithm of total assets, recorded a mean of 25.175 and a standard deviation of 0.657.p.7
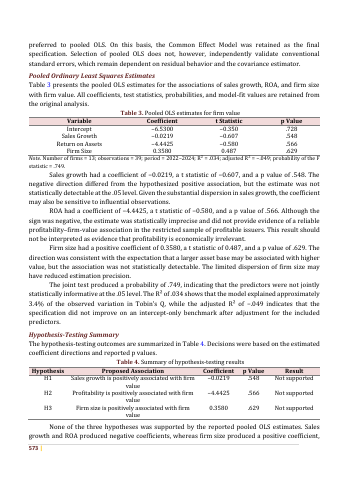
- The estimated pooled ordinary least squares regression model yielded an R² of .034 and an adjusted R² of −.049.p.8
Key insights
- Sales growth exhibited a negative but statistically non-detectable association with firm value, with a coefficient of −0.0219 and a p value of .548.p.8
- Return on assets showed a negative but statistically non-detectable relationship with firm value, producing a coefficient of −4.4425 and a p value of .566.p.8
- Firm size demonstrated a positive but statistically non-detectable association with firm value, generating a coefficient of 0.3580 and a p value of .629.p.8
- Model selection tests favored a pooled ordinary least squares specification over fixed or random effects models.p.7
- The three evaluated financial predictors were not jointly statistically significant, with a reported F statistic p value of .749.p.8
- None of the three hypotheses proposing positive associations between the financial signals and firm value were supported.p.8
- Conventional accounting-based indicators may have limited standalone explanatory power for firm value in information-constrained SME equity markets.p.12
Pages
 p.1
 p.2
 p.3
 p.4
 p.5
 p.6
 p.7
 p.8
 p.9
 p.10
 p.11
 p.12
 p.13
 p.14
 p.15
Topics and entities
Summary and figures generated from the document and checked automatically: every number shown appears on the cited page. Publishers can request removal.