Charts / Runway Growth Capital
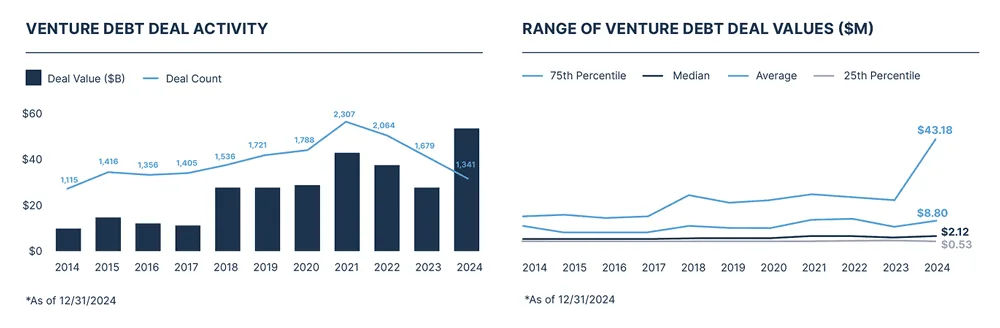
Venture Debt Counts 2016 – Q1 2026
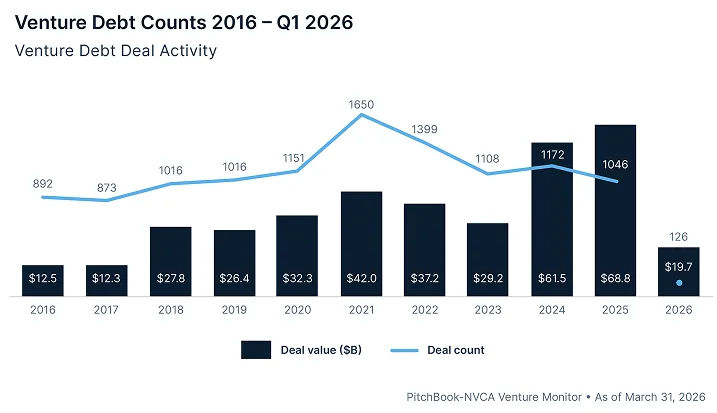
The chart illustrates venture debt deal activity from 2016 through Q1 2026, showing both annual total deal value in billions of dollars and total deal count.
| Label | Value shown on the chart |
|---|---|
| 2021 Deal value ($B) | $42.0 |
| 2021 Deal count | 1650 |
| 2022 Deal value ($B) | $37.2 |
| 2022 Deal count | 1399 |
| 2023 Deal value ($B) | $29.2 |
| 2023 Deal count | 1108 |
| 2024 Deal value ($B) | $61.5 |
| 2024 Deal count | 1172 |
| 2025 Deal value ($B) | $68.8 |
| 2025 Deal count | 1046 |
| 2026 Deal value ($B) | $19.7 |
| 2026 Deal count | 126 |
Shown as a preview with credit and a link to the original. Publishers can request removal.
View the original on runwaygrowth.com