Charts / Runway Growth Capital
ENERGY VENTURE DEBT DEAL ACTIVITY
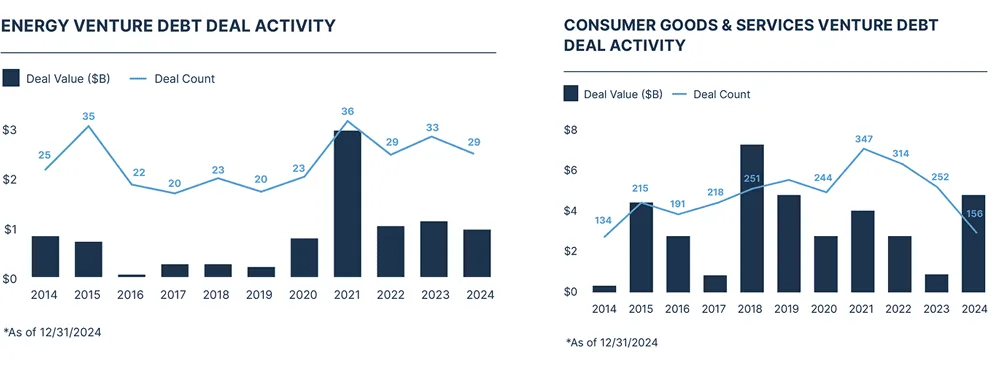
Annual deal count and total deal value ($B) for energy and consumer goods & services venture debt from 2014 to 2024. Energy venture debt deal count peaked at 36 in 2021, while consumer goods & services peaked at 347 in 2021.
| Label | Value shown on the chart |
|---|---|
| 2024 Energy Deal Count | 29 |
| 2023 Energy Deal Count | 33 |
| 2021 Energy Deal Count | 36 |
| 2015 Energy Deal Count | 35 |
| 2024 Consumer Goods & Services Deal Count | 156 |
| 2023 Consumer Goods & Services Deal Count | 252 |
| 2022 Consumer Goods & Services Deal Count | 314 |
| 2021 Consumer Goods & Services Deal Count | 347 |
| 2020 Consumer Goods & Services Deal Count | 244 |
| 2018 Consumer Goods & Services Deal Count | 251 |
| 2017 Consumer Goods & Services Deal Count | 218 |
| 2015 Consumer Goods & Services Deal Count | 215 |
Shown as a preview with credit and a link to the original. Publishers can request removal.
View the original on runwaygrowth.com