US high yield sector dispersion
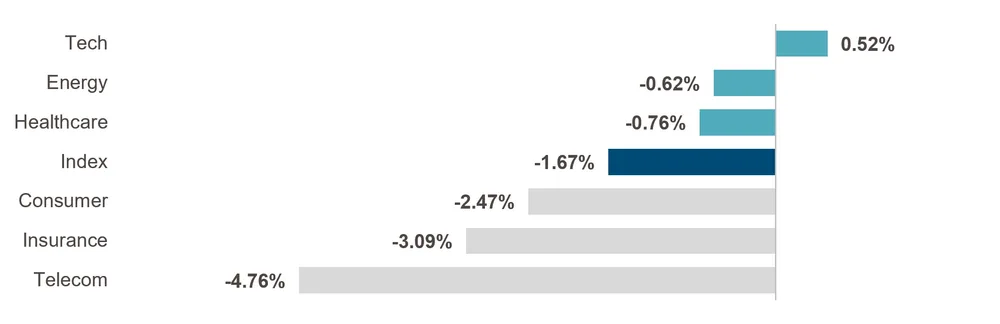
A horizontal bar chart illustrating sector performance dispersion in the US high yield market, ranging from Tech at 0.52% to Telecom at -4.76%.
| Label | Value shown on the chart |
|---|---|
| Tech | 0.52% |
| Energy | -0.62% |
| Healthcare | -0.76% |
| Index | -1.67% |
| Consumer | -2.47% |
| Insurance | -3.09% |
| Telecom | -4.76% |
Shown as a preview with credit and a link to the original. Publishers can request removal.
View the original on muzinich.com