US 10YR
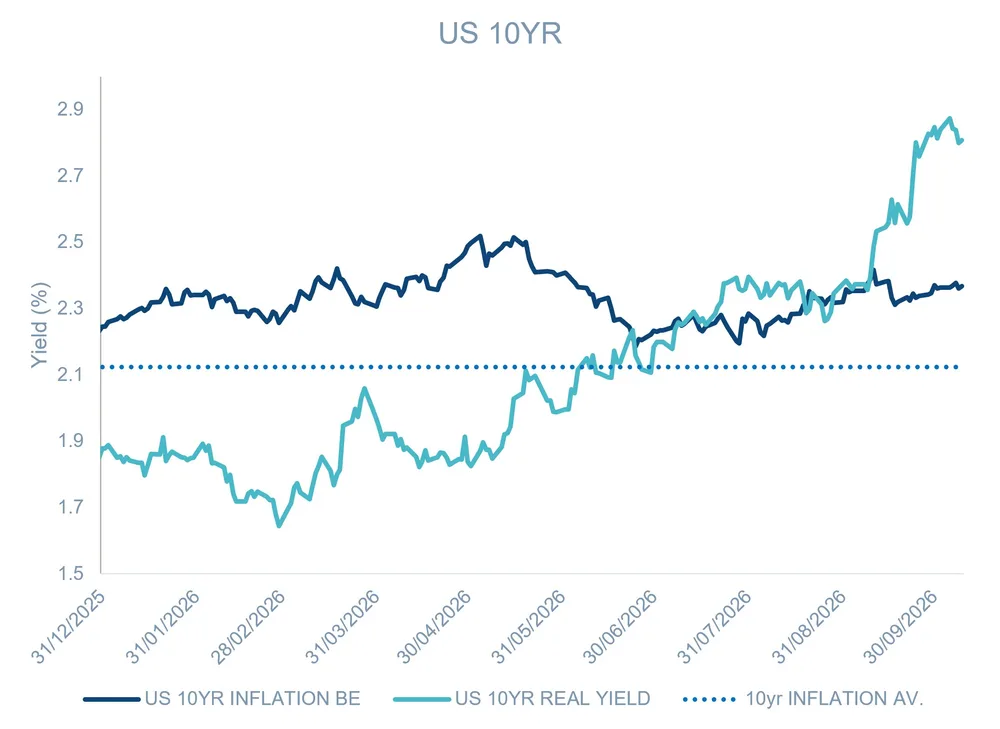
A line chart comparing the US 10-year inflation breakeven rate, US 10-year real yield, and 10-year inflation average from December 2025 to September 2026. It highlights a sharp increase in the 10-year real yield starting around August 2026.
Shown as a preview with credit and a link to the original. Publishers can request removal.
View the original on muzinich.com