B/BB US High Yield: yield to worst vs spread to worst
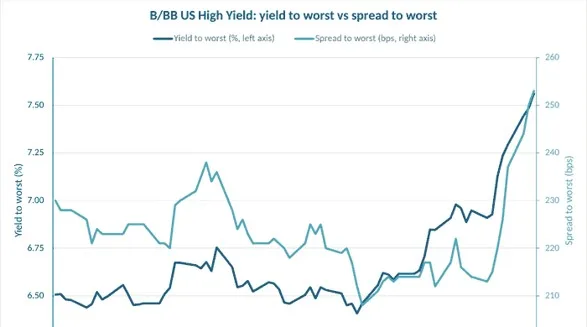
The line chart tracks the yield to worst (%) on the left axis and spread to worst (bps) on the right axis for B/BB US high yield bonds, showing a sharp upward trend at the right side of the chart.
Shown as a preview with credit and a link to the original. Publishers can request removal.
View the original on muzinich.com