SaaSmageddon: Present divergence, historical correlation - IGV vs. Nasdaq Performance During Major IGV Drawdowns Exceeding 20%
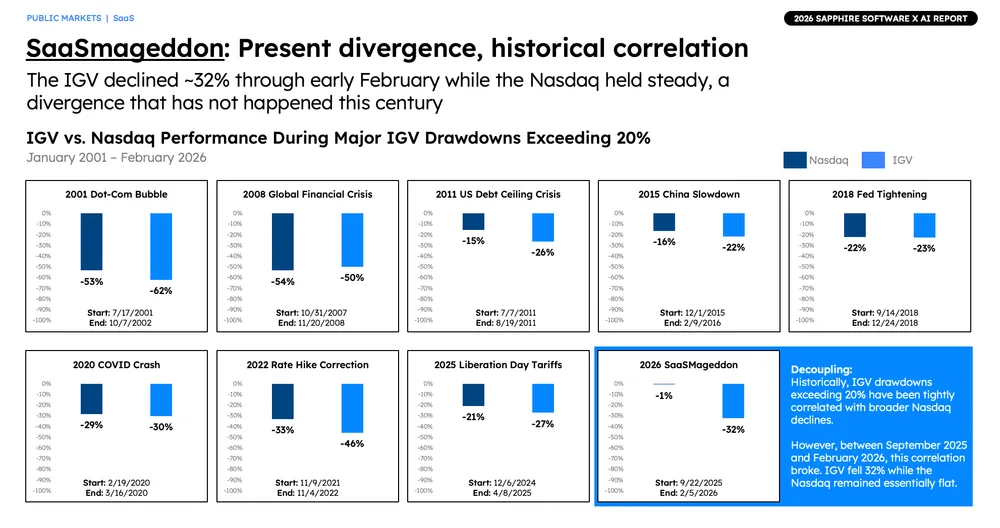
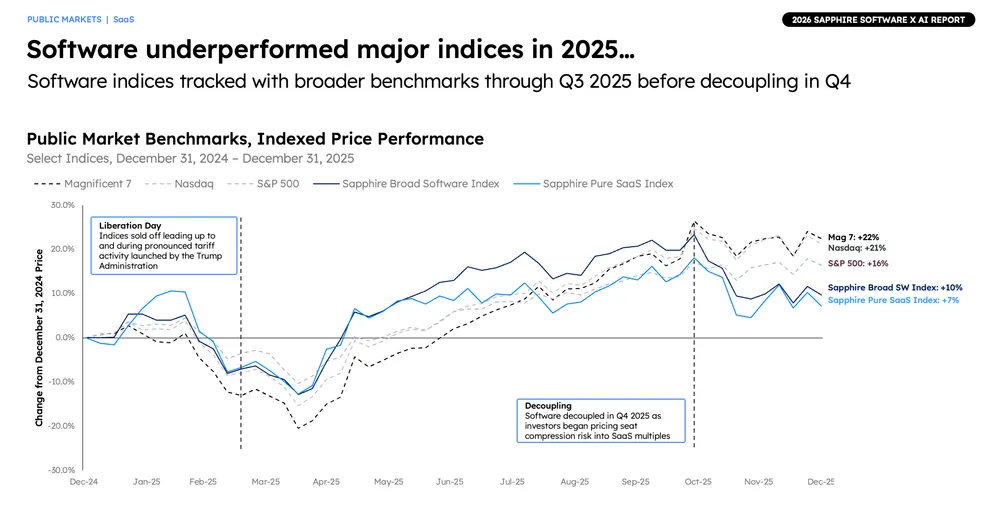
The chart compares IGV and Nasdaq percentage drawdowns during major software declines exceeding 20% between January 2001 and February 2026, highlighting a historical correlation that broke during the 2026 SaaSmageddon when IGV dropped 32% while Nasdaq fell only 1%.
| Label | Value shown on the chart |
|---|---|
| 2001 Dot-Com Bubble (Nasdaq) | -53% |
| 2001 Dot-Com Bubble (IGV) | -62% |
| 2008 Global Financial Crisis (Nasdaq) | -54% |
| 2008 Global Financial Crisis (IGV) | -50% |
| 2011 US Debt Ceiling Crisis (Nasdaq) | -15% |
| 2011 US Debt Ceiling Crisis (IGV) | -26% |
| 2015 China Slowdown (Nasdaq) | -16% |
| 2015 China Slowdown (IGV) | -22% |
| 2018 Fed Tightening (Nasdaq) | -22% |
| 2018 Fed Tightening (IGV) | -23% |
| 2026 SaaSmageddon (Nasdaq) | -1% |
| 2026 SaaSmageddon (IGV) | -32% |
Shown as a preview with credit and a link to the original. Publishers can request removal.
View the original on sapphireventures.com