Largest 20 Deals as a Percent of Total Enterprise Software VC Funding
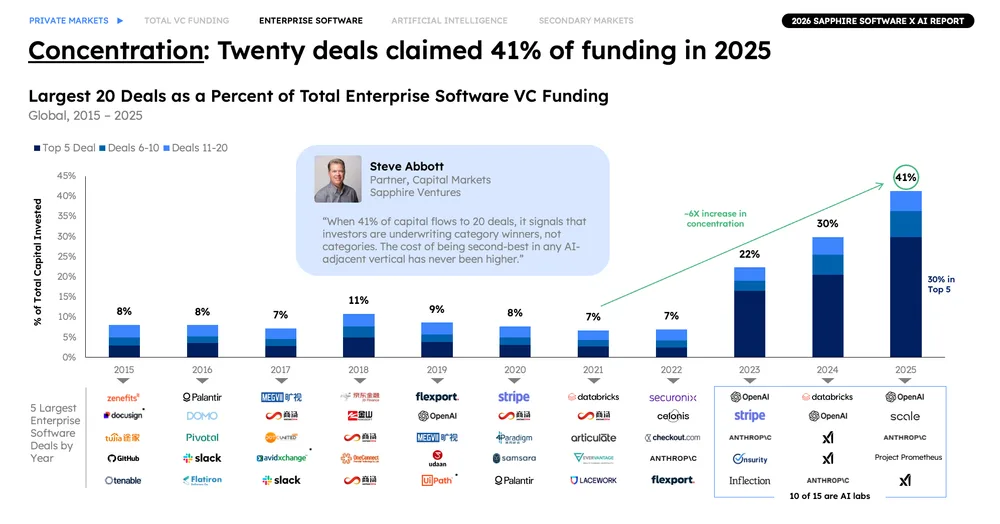
This chart tracks the percentage of global enterprise software VC funding captured by the 20 largest deals from 2015 to 2025. Funding concentration rose dramatically in recent years, reaching 41% in 2025 driven heavily by AI labs.
| Label | Value shown on the chart |
|---|---|
| 2015 | 8% |
| 2016 | 8% |
| 2017 | 7% |
| 2018 | 11% |
| 2019 | 9% |
| 2020 | 8% |
| 2021 | 7% |
| 2022 | 7% |
| 2023 | 22% |
| 2024 | 30% |
| 2025 | 41% |
Shown as a preview with credit and a link to the original. Publishers can request removal.
View the original on sapphireventures.com