AI-Native VC Funding Concentration by Layer
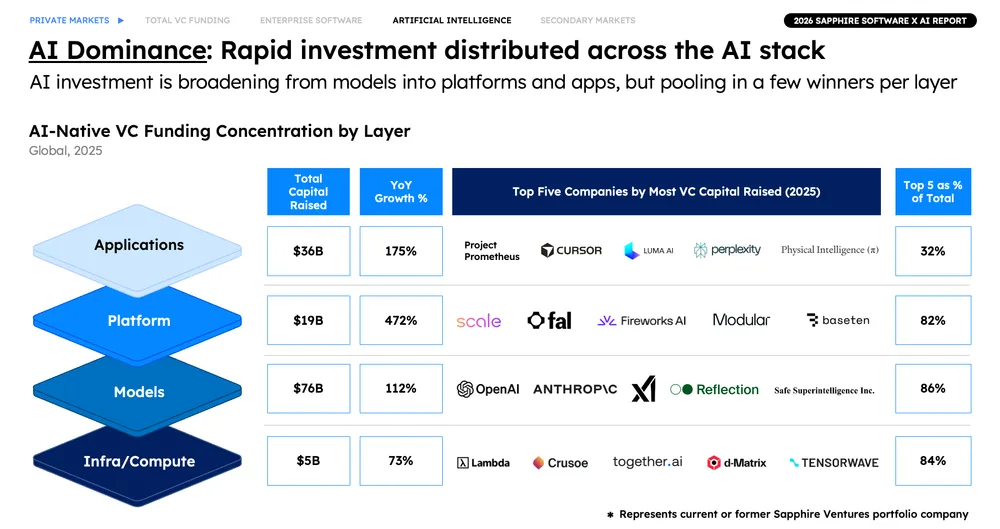
Global AI-native venture capital funding data in 2025 across four layers (Applications, Platform, Models, and Infra/Compute), showing total capital raised, YoY growth, and concentration among the top 5 companies per layer.
| Label | Value shown on the chart |
|---|---|
| Applications - Total Capital Raised | $36B |
| Applications - YoY Growth % | 175% |
| Applications - Top 5 as % of Total | 32% |
| Platform - Total Capital Raised | $19B |
| Platform - YoY Growth % | 472% |
| Platform - Top 5 as % of Total | 82% |
| Models - Total Capital Raised | $76B |
| Models - YoY Growth % | 112% |
| Models - Top 5 as % of Total | 86% |
| Infra/Compute - Total Capital Raised | $5B |
| Infra/Compute - YoY Growth % | 73% |
| Infra/Compute - Top 5 as % of Total | 84% |
Shown as a preview with credit and a link to the original. Publishers can request removal.
View the original on sapphireventures.com