Pure SaaS and Broad Software multiples are reaching historic lows
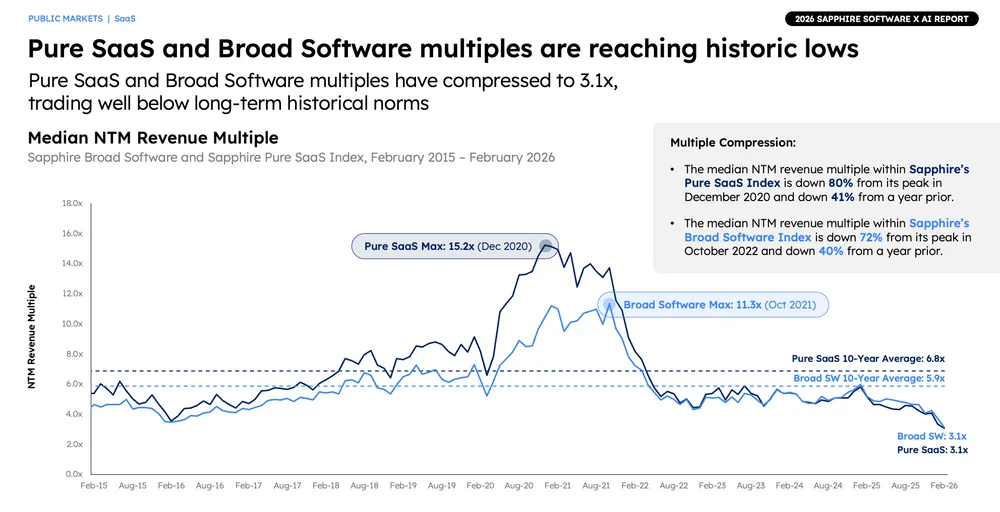
Line chart showing the median NTM revenue multiple for Sapphire Pure SaaS Index and Sapphire Broad Software Index from February 2015 to February 2026. Both indexes compressed to 3.1x by February 2026, well below their 10-year averages.
| Label | Value shown on the chart |
|---|---|
| Pure SaaS Max (Dec 2020) | 15.2x |
| Broad Software Max (Oct 2021) | 11.3x |
| Pure SaaS 10-Year Average | 6.8x |
| Broad SW 10-Year Average | 5.9x |
| Broad SW (Feb 2026) | 3.1x |
| Pure SaaS (Feb 2026) | 3.1x |
Shown as a preview with credit and a link to the original. Publishers can request removal.
View the original on sapphireventures.com