Charts / Runway Growth Capital
Private Credit AUM & Annualized Growth, 2011-2029F ($bn)
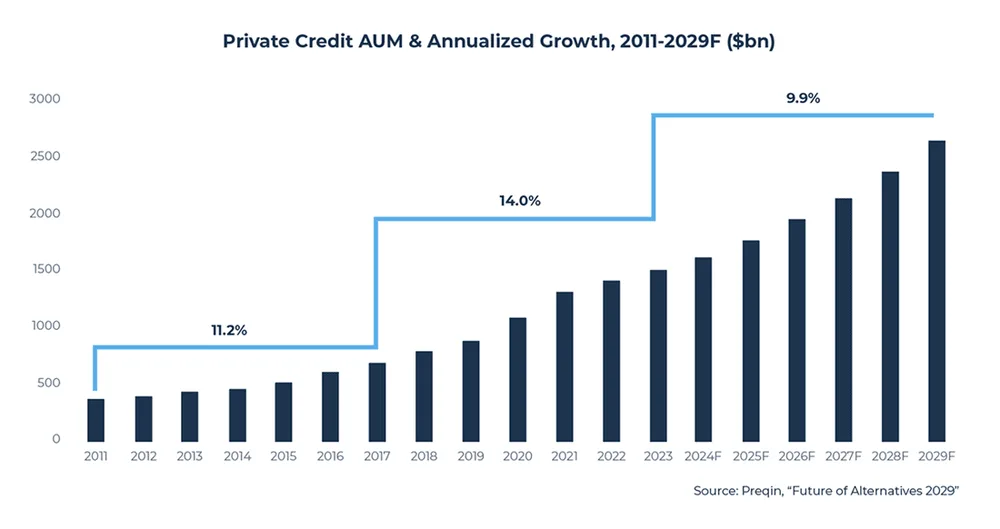
The chart illustrates historical and forecasted private credit assets under management from 2011 to 2029, showcasing annualized growth rates across three distinct periods: 11.2% (2011-2017), 14.0% (2017-2023), and 9.9% (2023-2029F).
| Label | Value shown on the chart |
|---|---|
| 2011-2017 Annualized Growth | 11.2% |
| 2017-2023 Annualized Growth | 14.0% |
| 2023-2029F Annualized Growth | 9.9% |
Shown as a preview with credit and a link to the original. Publishers can request removal.
View the original on runwaygrowth.com