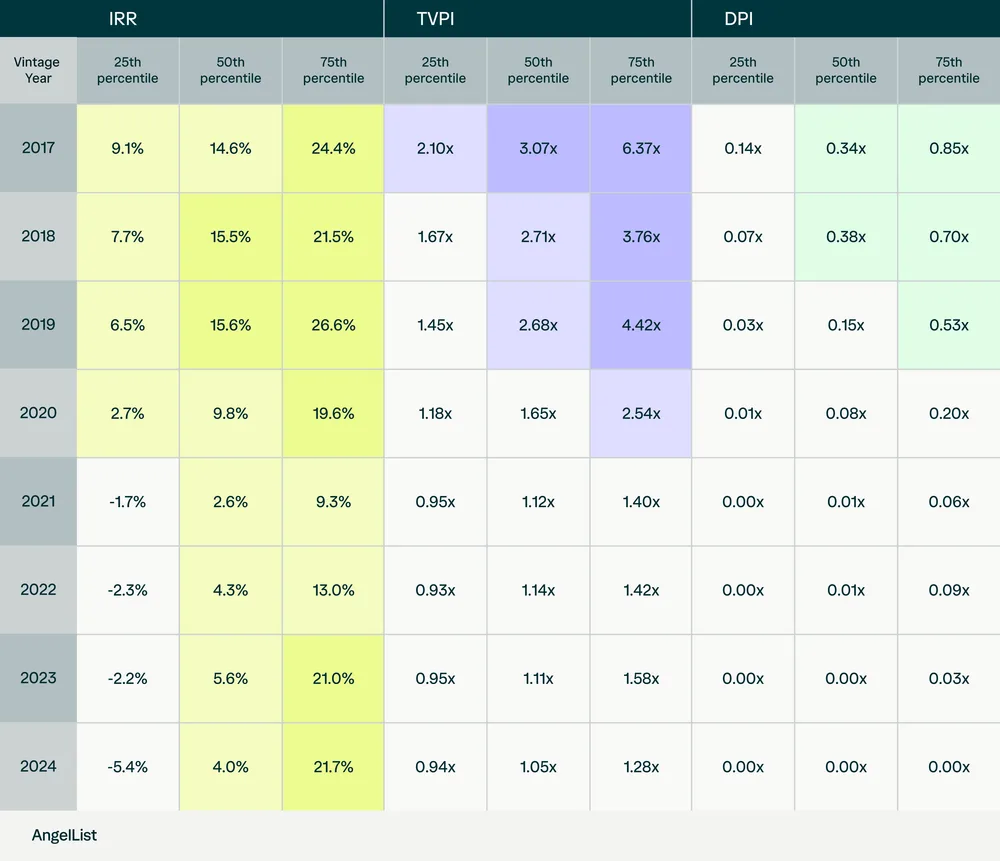
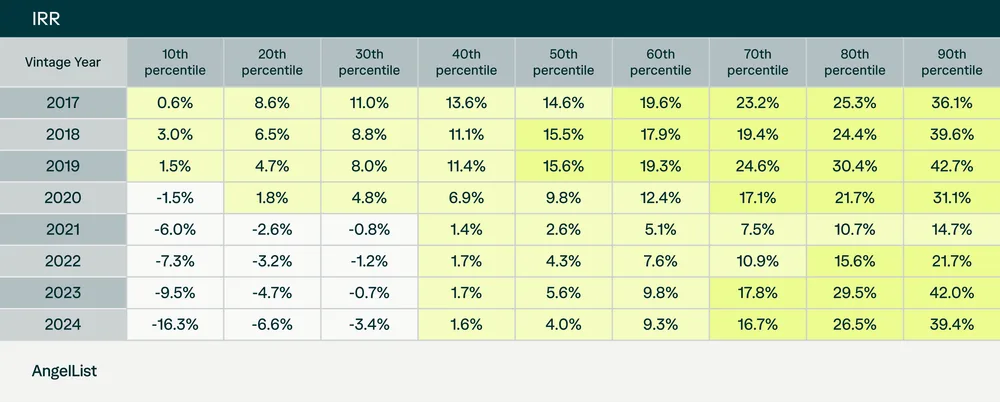
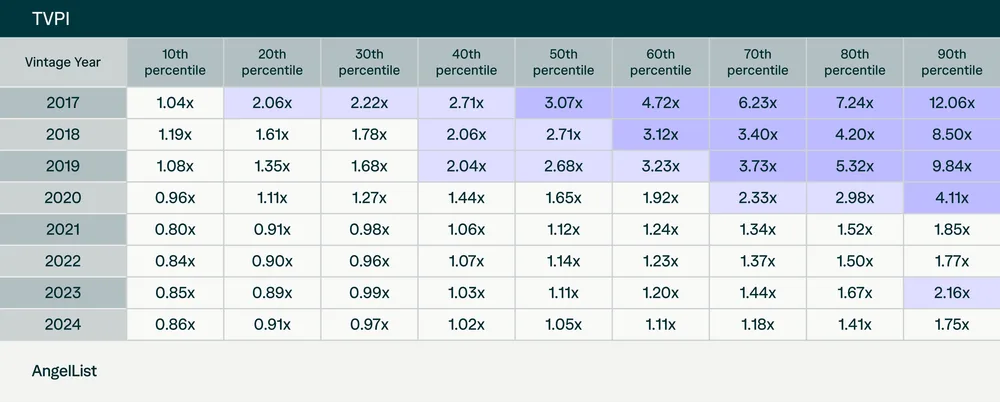
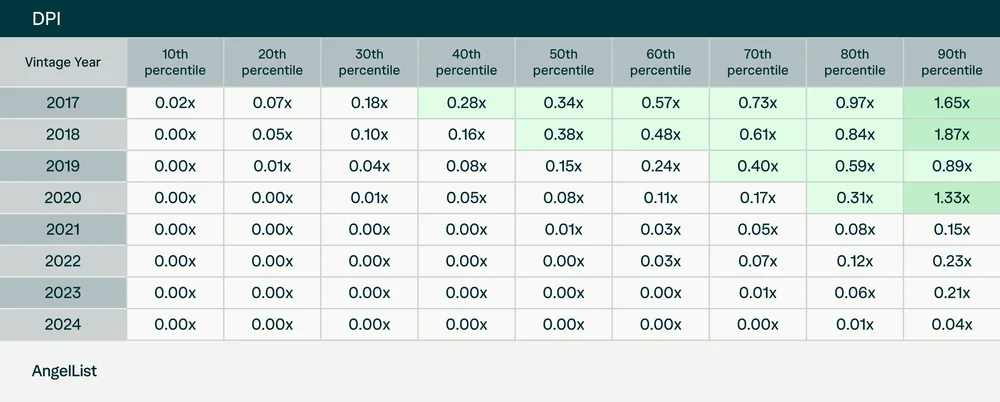
AngelList Funds Performance Over Time
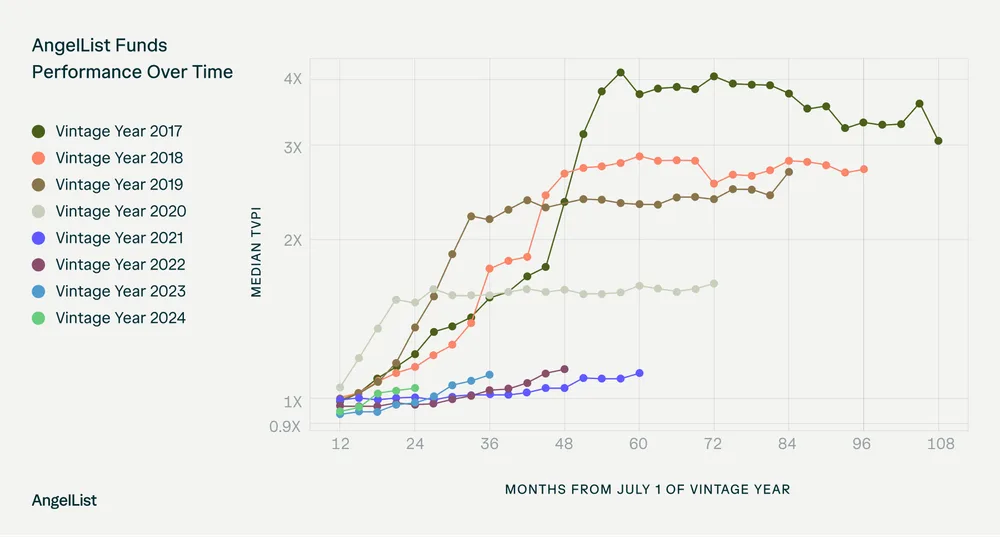
Line chart displaying the median TVPI of AngelList venture funds by vintage year (2017 to 2024) plotted against months from July 1 of the vintage year. Older vintages such as 2017 and 2018 demonstrate significantly higher median TVPIs reaching nearly 4X and 3X respectively, whereas post-2020 vintages show lower early-stage multiples around 1X to 1.5X.
Shown as a preview with credit and a link to the original. Publishers can request removal.
View the original on angellist.com