Can Generative AI Preserve Tail-Risk Networks? Evidence from Cryptocurrency Markets (Research Square)
SaveWhat changed
3.1%
Population expected shortfall excess of correlation-matching copula versus true-network benchmark p.2
Summary
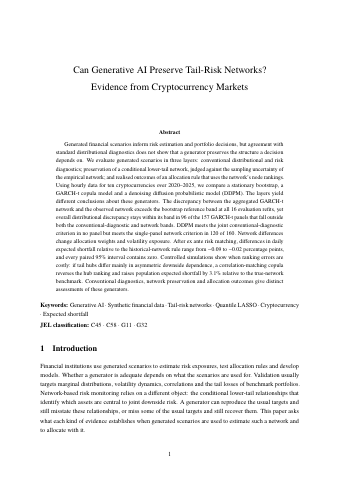
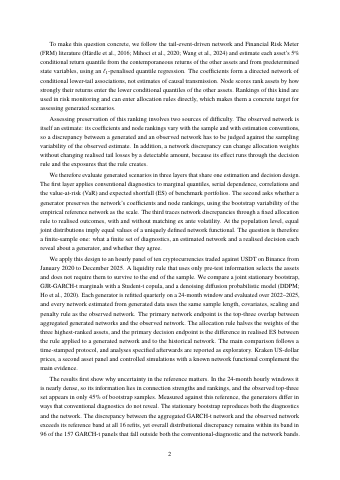
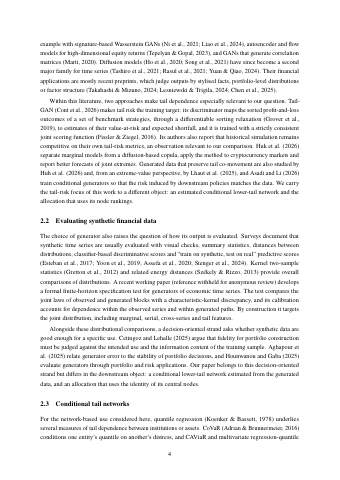
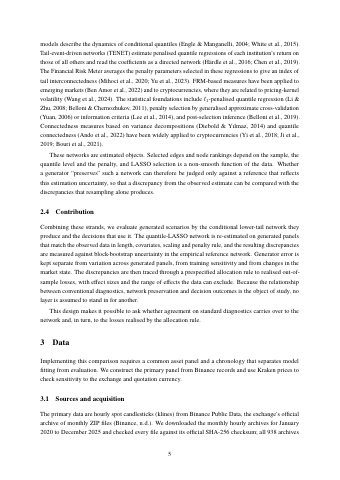
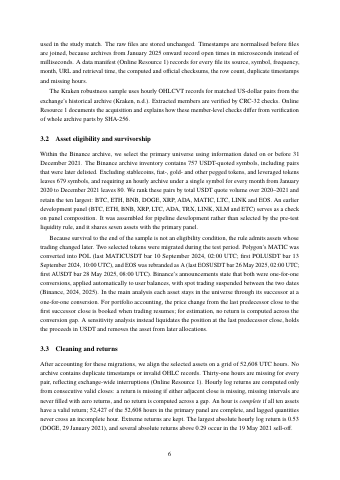
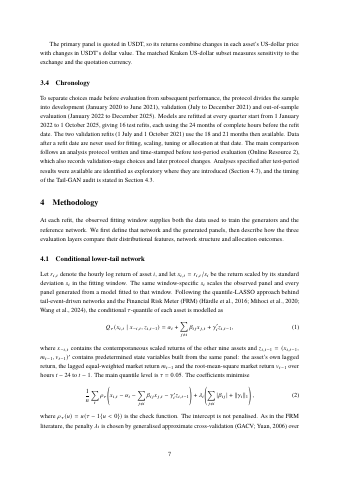
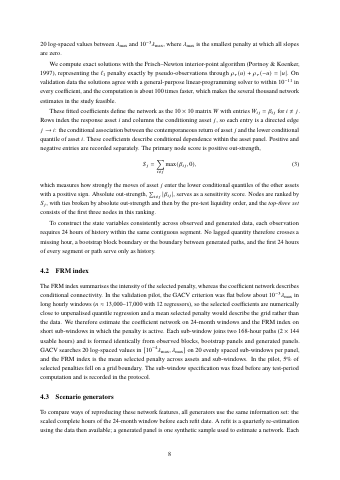
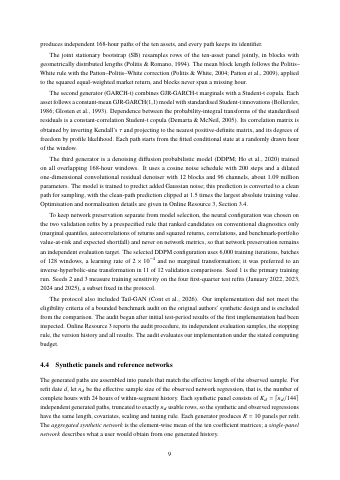
- The study evaluates generated financial scenarios in three layers using hourly data for ten cryptocurrencies over 2020–2025, comparing a stationary bootstrap, a GARCH-t copula model and a diffusion model (DDPM).p.2
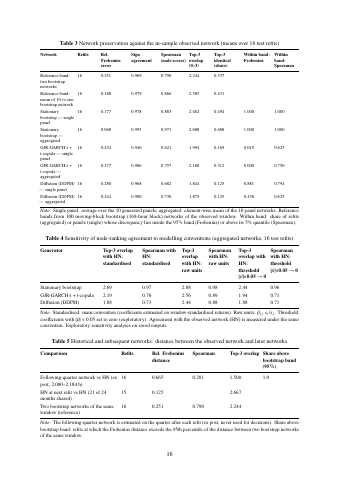
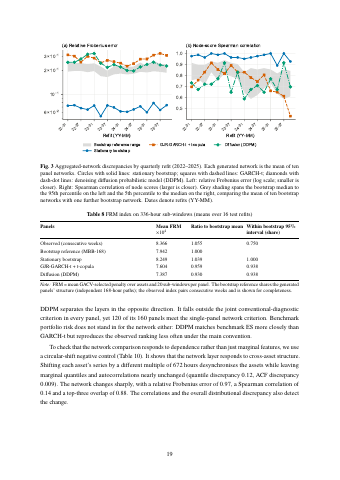
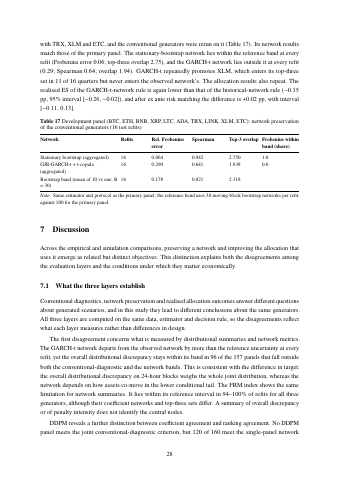
- The discrepancy between the aggregated GARCH-t network and the observed network exceeds the bootstrap reference band at all 16 evaluation refits.p.2
- DDPM meets the joint conventional-diagnostic criterion in no panel but meets the single-panel network criterion in 120 of 160.p.2
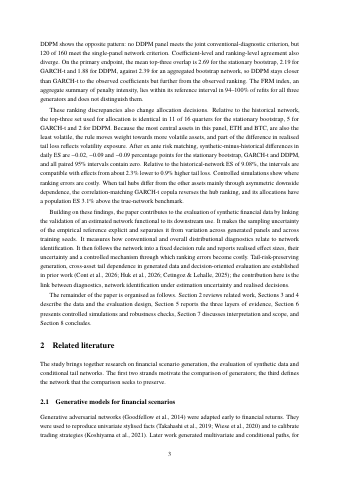
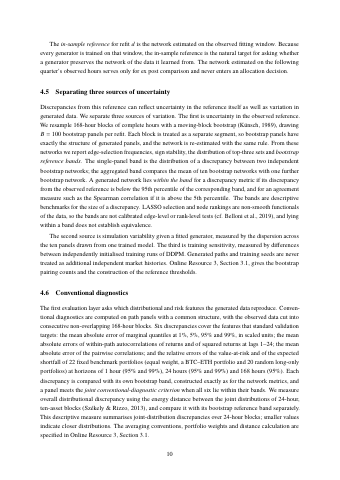
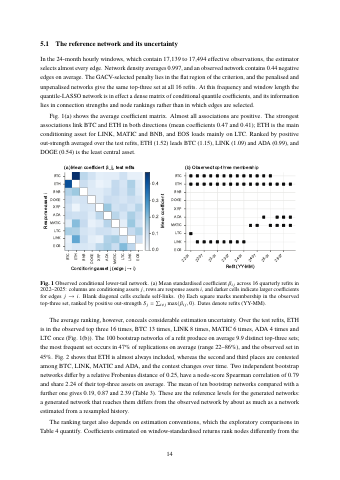
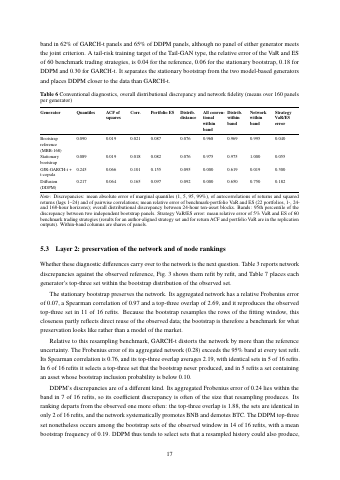
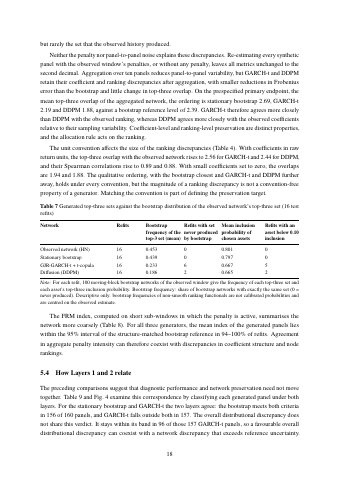
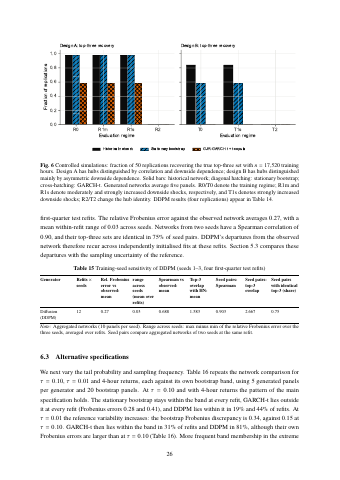
- On the primary endpoint, mean top-three overlap is 2.69 for the stationary bootstrap, 2.19 for GARCH-t and 1.88 for DDPM, against 2.39 for an aggregated bootstrap network.p.4
- The top-three set matches the historical network in 11 of 16 quarters for the stationary bootstrap, 5 for GARCH-t and 2 for DDPM.p.4
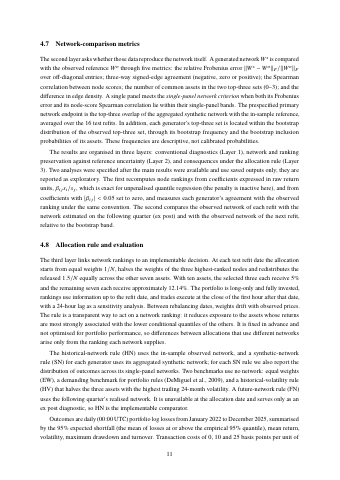
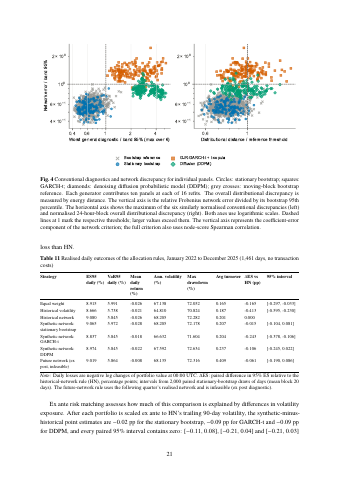
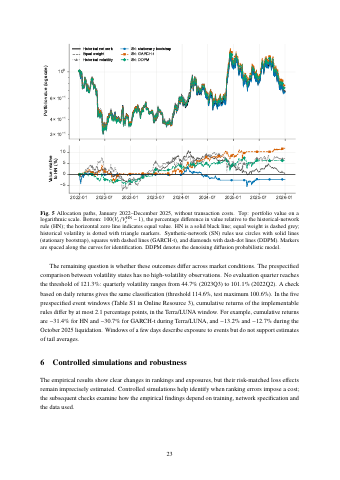
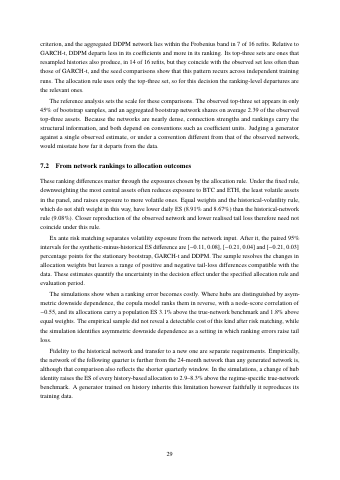
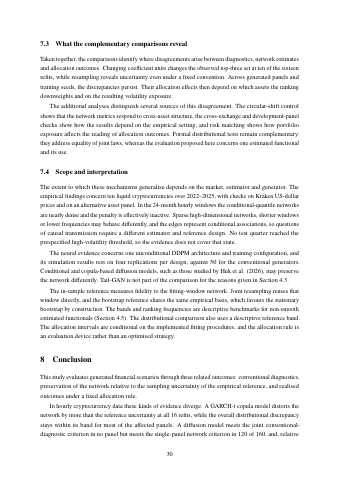
- After ex ante risk matching, differences in daily expected shortfall range from −0.09 to −0.02 percentage points, and every paired 95% interval contains zero.p.2
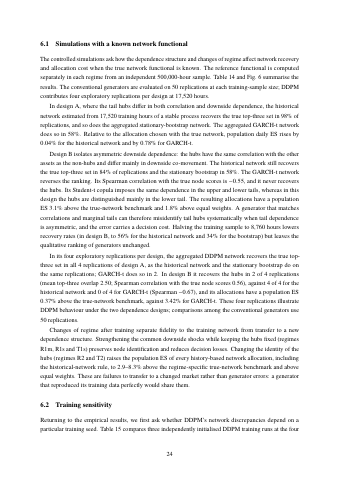
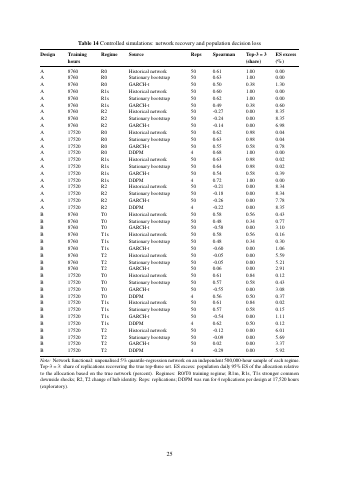
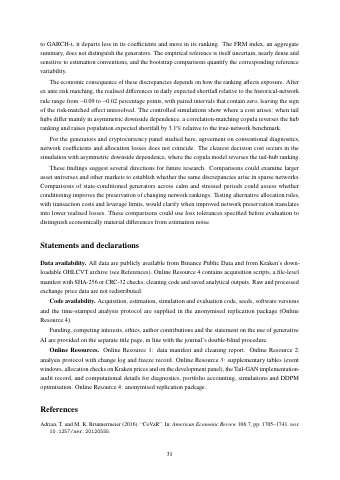
- In controlled simulations, a correlation-matching copula reverses the hub ranking and raises population expected shortfall by 3.1%.p.2
Key insights
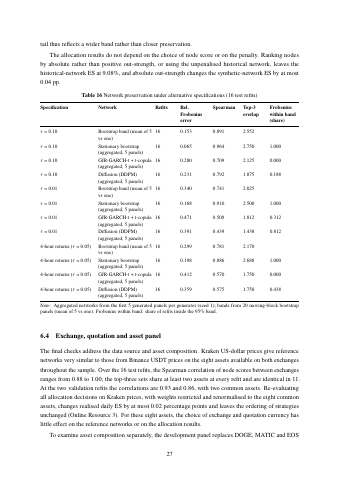
- The FRM index lies within its reference interval in 94–100% of refits for all three generators and does not distinguish them.p.4
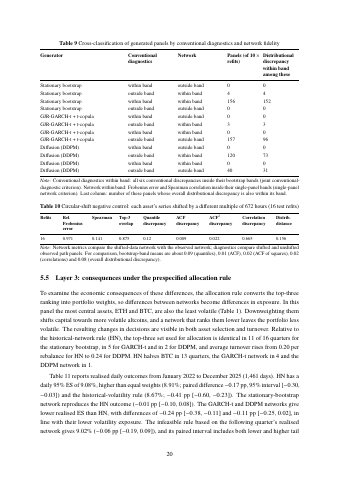
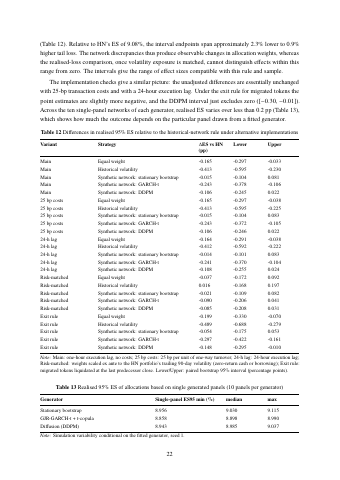
- Relative to the historical-network expected shortfall of 9.08%, the intervals are compatible with effects from about 2.3% lower to 0.9% higher tail loss.p.4
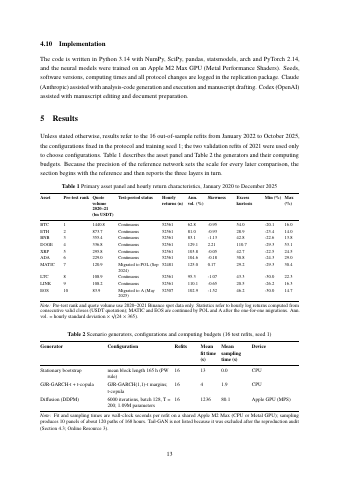
- Ranked by positive out-strength, ETH (1.52) leads BTC (1.15), LINK (1.09) and ADA (0.99), while DOGE (0.54) is the least central asset.p.15
- The observed top-three set is the same under raw-unit and standardised coefficients at only 6 of 16 refits.p.16
- The network estimated on the following quarter differs from the fitting-window network by a relative Frobenius distance of 0.67, with a node-score Spearman correlation of 0.28 and a top-three overlap of 1.50.p.16
- The relative error of VaR and ES of 60 benchmark strategies is 0.04 for the reference, 0.06 for the stationary bootstrap, 0.18 for DDPM and 0.30 for GARCH-t.p.18
- When hubs differ mainly in downside dependence, the GARCH-t Spearman correlation with true node scores is −0.55 and its allocations have an expected shortfall 3.1% above the true-network benchmark and 1.8% above equal weights.p.25
- Because ETH and BTC are the most central and least volatile assets, the allocation rule moves weight toward more volatile assets.p.4
Pages
 p.1
 p.2
 p.3
 p.4
 p.5
 p.6
 p.7
 p.8
 p.9
 p.10
 p.11
 p.12
 p.13
 p.14
 p.15
 p.16
 p.17
 p.18
 p.19
 p.20
 p.21
 p.22
 p.23
 p.24
 p.25
 p.26
 p.27
 p.28
 p.29
 p.30
 p.31
 p.32
 p.33
 p.34
 p.35
 p.36
Funders mentioned
Topics and entities
Summary and figures generated from the document and checked automatically: every number shown appears on the cited page. Publishers can request removal.