VC M&A activity with VC-backed buyer as a share of all VC M&A activity
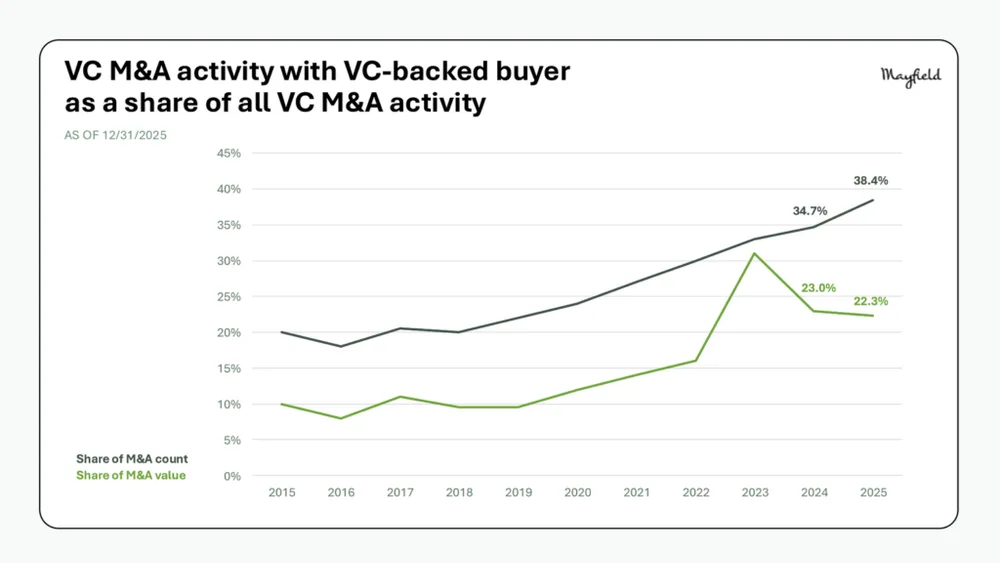
Line chart measuring the proportion of VC M&A activity involving VC-backed buyers by count and total value from 2015 to 2025. By 2025, the share of M&A count rose to 38.4%, while the share of M&A value stood at 22.3%.
| Label | Value shown on the chart |
|---|---|
| 2024 Share of M&A count | 34.7% |
| 2025 Share of M&A count | 38.4% |
| 2024 Share of M&A value | 23.0% |
| 2025 Share of M&A value | 22.3% |
Shown as a preview with credit and a link to the original. Publishers can request removal.
View the original on mayfield.com