US VC fundraising activity
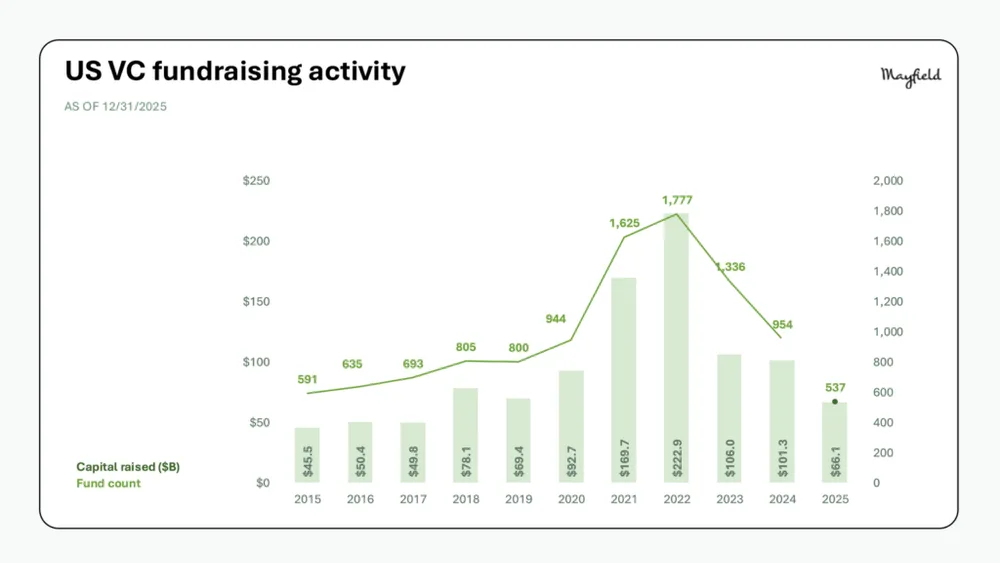
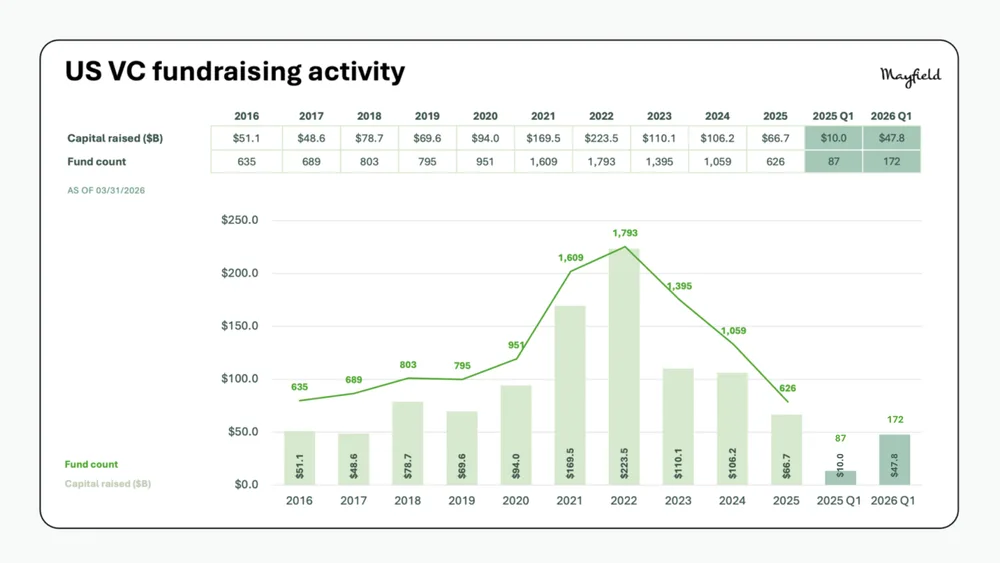
This chart illustrates US venture capital fundraising activity between 2015 and 2025, tracking both total capital raised in billions of dollars and the total fund count, peaking in 2022 at $222.9B raised across 1,777 funds.
| Label | Value shown on the chart |
|---|---|
| 2015 | $45.5B |
| 2016 | $50.4B |
| 2017 | $49.8B |
| 2018 | $78.1B |
| 2019 | $69.4B |
| 2020 | $92.7B |
| 2021 | $169.7B |
| 2022 | $222.9B |
| 2023 | $106.0B |
| 2024 | $101.3B |
| 2025 | $66.1B |
Shown as a preview with credit and a link to the original. Publishers can request removal.
View the original on mayfield.com