US VC exit activity
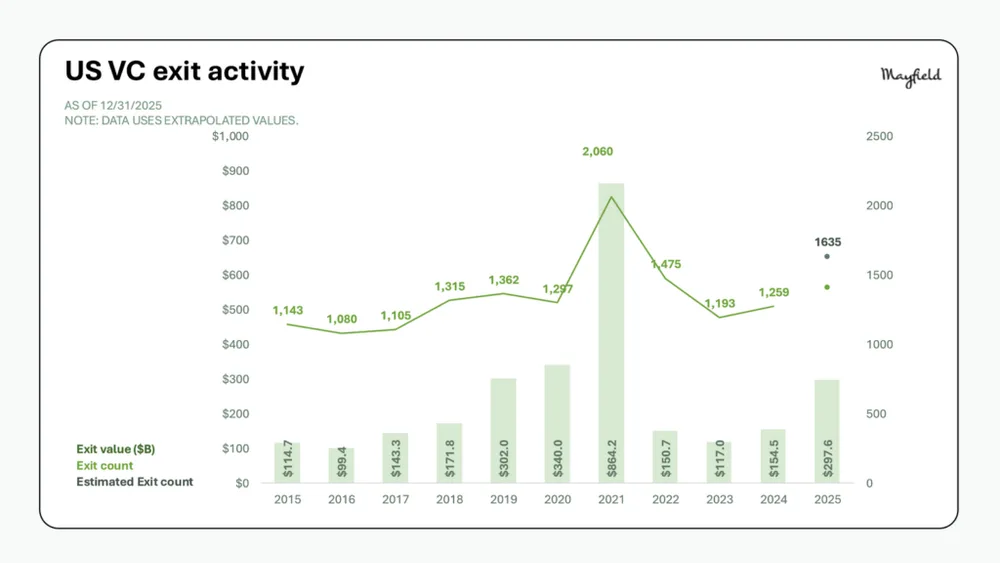
The chart illustrates annual US VC exit activity from 2015 to 2025, tracking both exit value in billions of dollars and exit counts. Exit value peaked in 2021 at $864.2B across 2,060 exits.
| Label | Value shown on the chart |
|---|---|
| 2015 Exit value | $114.7B |
| 2016 Exit value | $99.4B |
| 2017 Exit value | $143.3B |
| 2018 Exit value | $171.8B |
| 2019 Exit value | $302.0B |
| 2020 Exit value | $340.0B |
| 2021 Exit value | $864.2B |
| 2022 Exit value | $150.7B |
| 2023 Exit value | $117.0B |
| 2024 Exit value | $154.5B |
| 2025 Exit value | $297.6B |
Shown as a preview with credit and a link to the original. Publishers can request removal.
View the original on mayfield.com