US VC deal activity
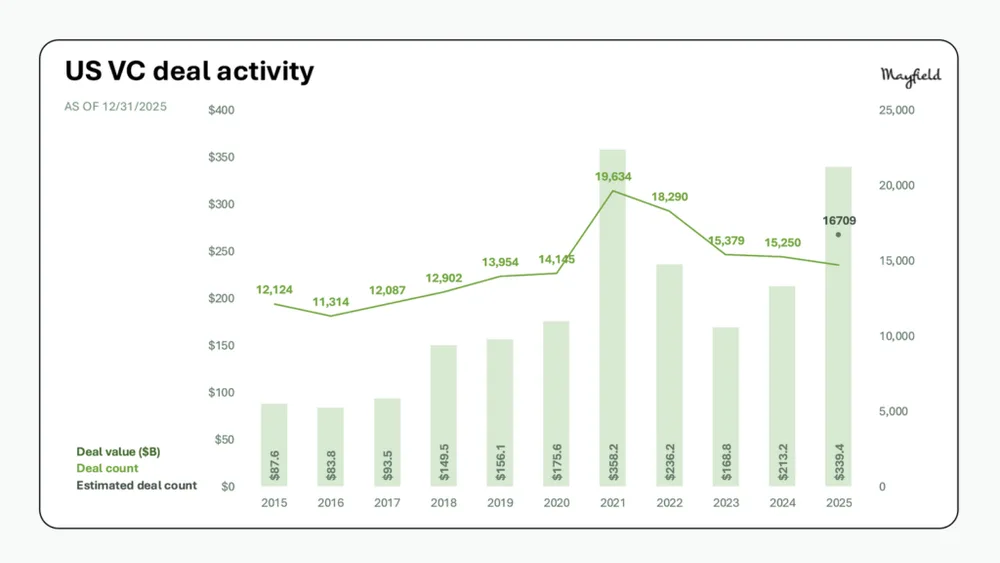
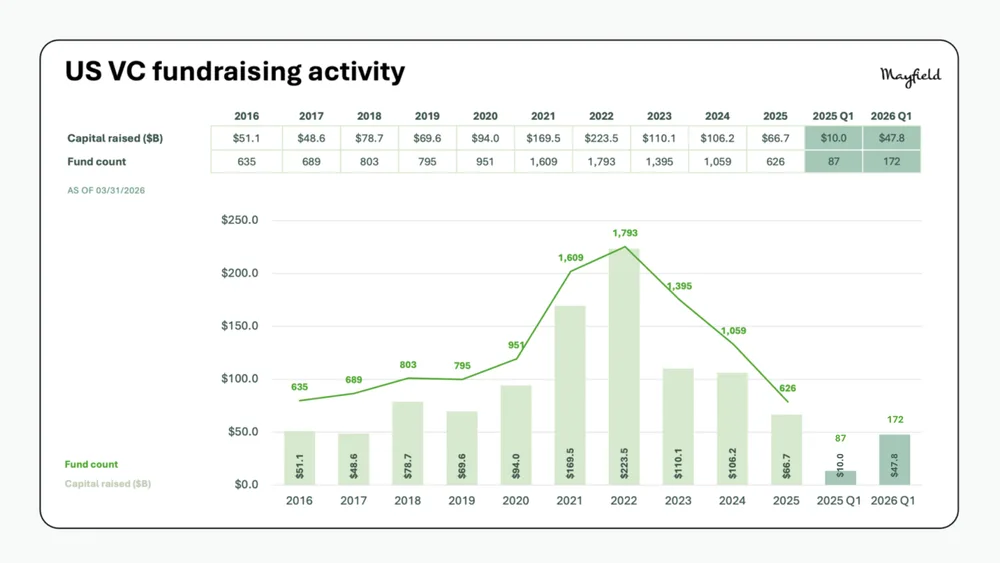
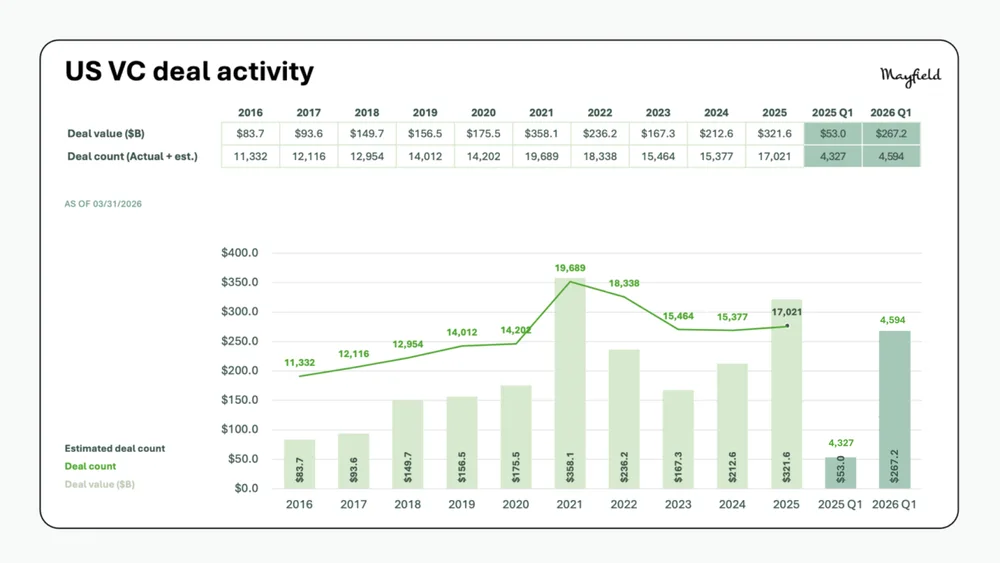
This chart illustrates US venture capital deal activity from 2015 to 2025, tracking both annual deal value in billions of dollars and total deal count.
| Label | Value shown on the chart |
|---|---|
| 2015 Deal value ($B) | 87.6 |
| 2016 Deal value ($B) | 83.8 |
| 2017 Deal value ($B) | 93.5 |
| 2018 Deal value ($B) | 149.5 |
| 2019 Deal value ($B) | 156.1 |
| 2020 Deal value ($B) | 175.6 |
| 2021 Deal value ($B) | 358.2 |
| 2022 Deal value ($B) | 236.2 |
| 2023 Deal value ($B) | 168.8 |
| 2024 Deal value ($B) | 213.2 |
| 2025 Deal value ($B) | 339.4 |
Shown as a preview with credit and a link to the original. Publishers can request removal.
View the original on mayfield.com